Sunday July 12th… Dear Diary. The main purpose of this ongoing blog will be to track United States extreme or record temperatures related to climate change. Any reports I see of ETs will be listed below the main topic of the day. I’ll refer to extreme or record temperatures as ETs (not extraterrestrials). 😉
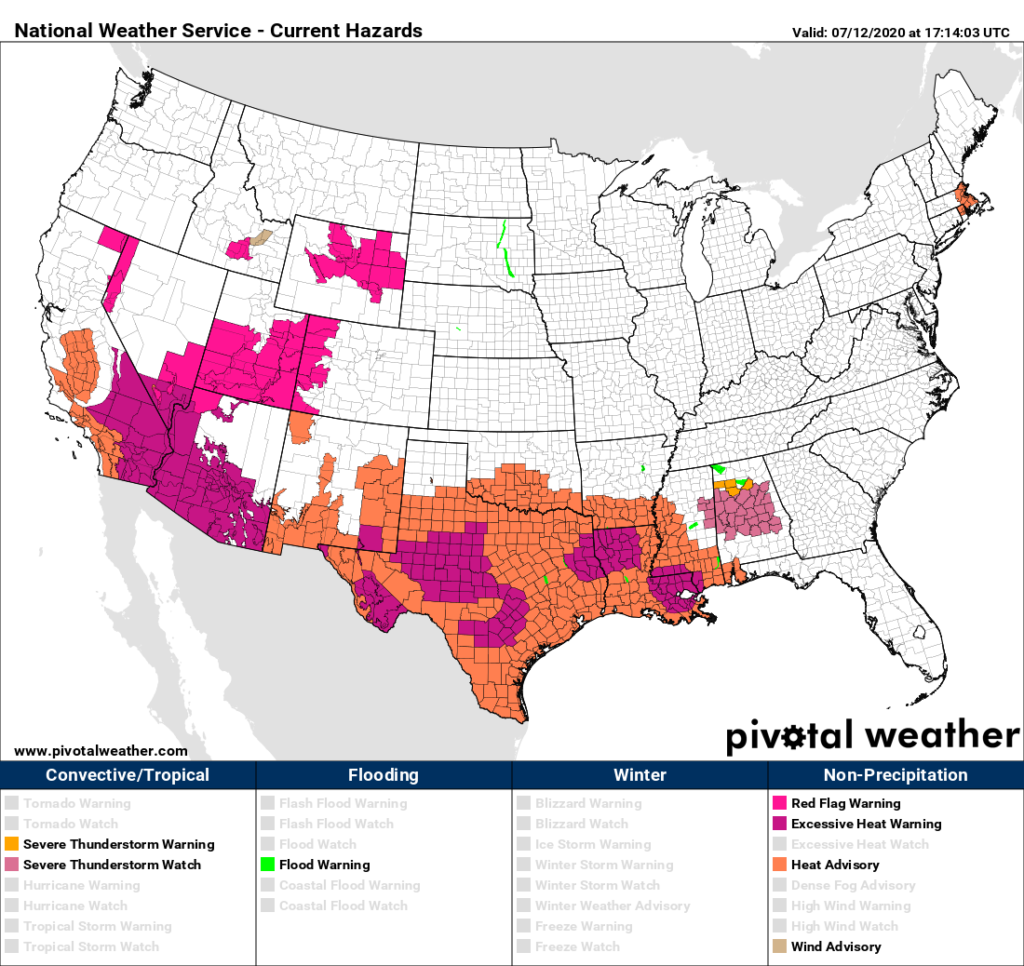
Dear Diary. As usual to start this blog let’s access U.S. heat levels for the next two days. Our mid level CAT 2 heat wave from Saturday is continuing to intensify across the south-central states with numerous advisories posted on this Sunday morning. Excessive heat warnings have popped up in some locations in Texas and Louisiana. The heat wave has peaked in the Southwest today:
On Monday heat will begin intensifying across the south-central states. Dallas should see a max in excess of 100F with a heat index near 110F:

Most guidance is forecasting the next peak of our heat dome to occur in Thursday with the center being located over Arkansas at about 596 decameters:
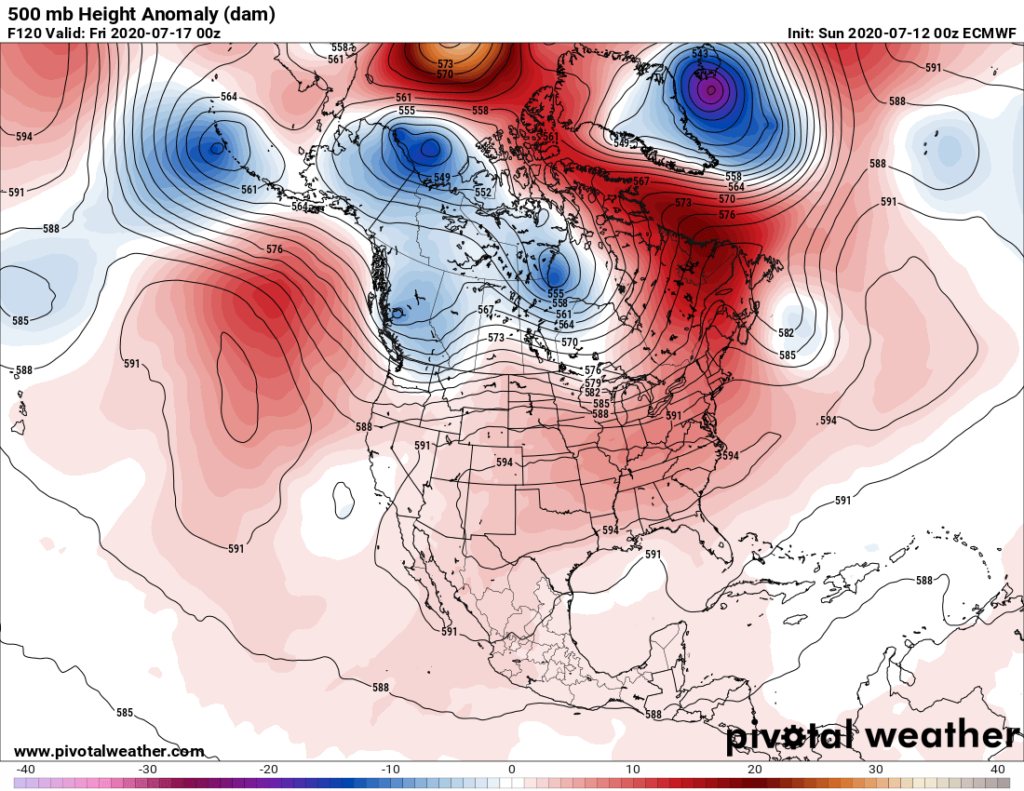
On the above chart we see a slight dip in the jet extending from Hudson Bay southward to the Great Lakes, which would be a forecast weak front. This system will pull hot air building over the southern Plains into the mid Mississippi Valley, Southeast, and Middle Atlantic States:
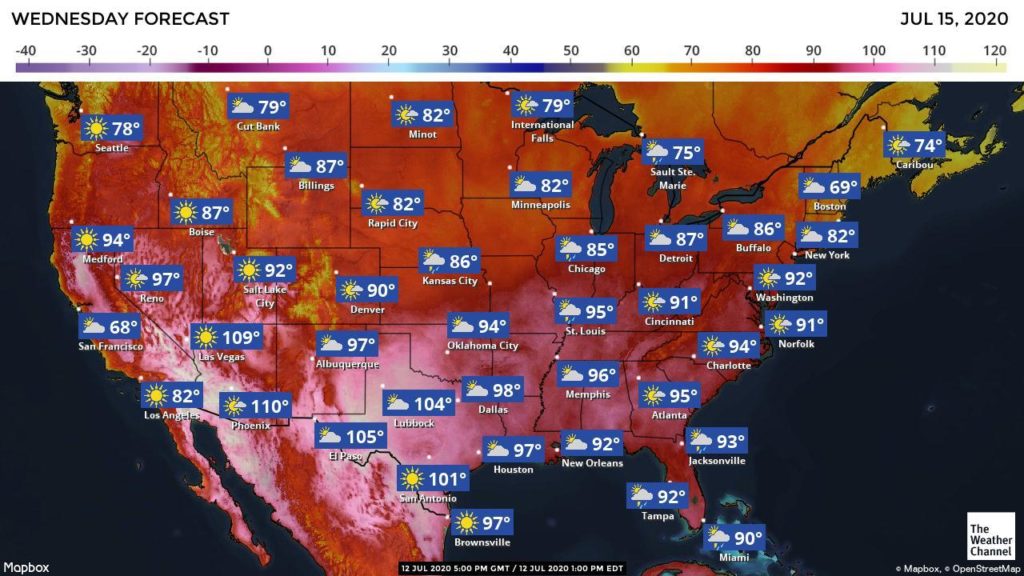
Wednesday or Thursday should be the hottest days east of the Rockies in which some daily records should be set. By this point we should have a CAT3 heat wave. However, it does not look like it will get hot enough for monthly or all-time records to be set pushing the heat wave to a historic CAT4 level. I’m sure that by Tuesday and Wednesday heat advisories will get posted by the National Weather Service as far north as St. Louis and Washington D.C.
Unfortunately, behind this first weak front our ridge will rebuild over the central Plains next week with above average 500 millibar heights extending from coast to coast:

The bottom line here is that this summer of 2020 heat wave will be historic for its longevity. It remains to be seen if it gets hot enough to produce many monthly or all-time records, though.
More on this heat wave:
And here are some humid day trends from Climate Central:
Humid Heat Extremes on the Rise
JUL 8, 2020
As the climate warms, the frequency of extreme heat and humidity has already doubled in most U.S.
locations.
KEY CONCEPTS | POTENTIAL LOCAL STORY ANGLES
EXPERTS TO INTERVIEW | METHODOLOGY
KEY CONCEPTS
- Heat is the deadliest form of extreme weather, and it’s especially dangerous with high humidity. Recent research from Columbia University shows that humid heat extremes are becoming more frequent.
- The researchers later analyzed the most extreme (top 5% of) days by U.S. location, based on wet bulb temperatures. In most places, these humid heat extremes doubled in frequency from 1980-1999 to 2000-2019.
- Disproportionate impacts fall on senior citizens and communities of color, as well as outdoor workers in agriculture and the military. Continued climate change would lead to declines in labor productivity, while worsening social and economic inequities.
- And then there’s the pandemic. As cooling centers close and cities shift plans, it will take efforts at all levels to keep people safe.

Extreme Humid Heat is Happening More Often
Find All Image Types Here (JPG & PNG)

The State-by-State Rise in Extreme Humid Heat
Find All Image Types Here (JPG & PNG)
Heat is the deadliest form of extreme weather, and it’s especially dangerous when paired with high humidity. If it’s too damp to cool off by sweating, the consequences can be fatal. Most days are far less serious, but the worst conditions are occurring more often as the climate warms—according to recent research from Columbia University.
The study focused on extreme wet bulb temperatures, which measure how heat, moisture, and other factors affect the body in direct sunlight. (You can see how extremes vary globally in the researchers’ interactive). Outdoor activities are all but impossible when the wet bulb reaches 90°F (equivalent to a 132°F heat index), but much lower values are still dangerous. For this release, the researchers analyzed the most extreme 5% of days in a locality, using hourly data from over 450 U.S. stations.
In most states and regions, these humid heat extremes have already doubled in frequency—when comparing 2000-2019 to the previous two decades. In other words, conditions on the muggiest 18 days of the year (on average in 1980-99) may now occur on 36 days or more. All but one region has seen these frequencies double, and all but one state has risen by 50%. Parts of New England and the inland West have increased by 2.5 times.
Why such a big jump? Consider the bell curve below; even small shifts in averages lead to large changes in extremes. As temperatures rise in a warming climate, humid heat extremes are persisting—a trend that will worsen unless we reduce greenhouse gas emissions.

Impacts are already visible. Humid heat led to several deaths last year, and recent temperatures have broken records from Phoenix to Florida. But not everyone is affected equally. Disproportionate impacts fall on senior citizens and communities of color, as well as outdoor workers in agriculture and the military. Continued climate change would lead to declines in labor productivity, while worsening social and economic inequities.
And then there’s the pandemic. Many cooling centers remain closed, increasing the need for home air conditioning even as cooling costs rise. While many cities are shifting response plans and subsidizing AC units or utility bills, it will take efforts at all levels to keep people safe. Simply checking on neighbors could help save lives.
Read Climate Central’s partnership story on humid heat with WJCT News in Florida: Warming Brings Muggier Weather to Jacksonville, Threatening Most Vulnerable
POSSIBLE LOCAL NEWS ANGLES
How is heat and humidity changing in your area?
See how extreme heat index days have trended locally, in Climate Central’s 2019 report on heat and sports. For projections, check out this comprehensive map tool from the Union of Concerned Scientists.
How are these changes affecting health?
The 2018 National Climate Assessment details how the rise of extreme heat is already impacting health. The CDC distills these health risks into infographics (both English and Spanish). And in June, the Global Heat Health Information Network issued a peer-reviewed technical brief on the compound risk of COVID-19, as well as recommendations for communities and health systems.
What work is being done to protect vulnerable populations?
Many efforts were discussed in Climate Central’s recent webinar on extreme heat and COVID-19. Related resources include an EPA guidebook for excessive heat response, stories and projects from ISeeChange, and example strategies from the National Integrated Heat Health Information System.
NATIONAL EXPERTS
Colin Raymond, Ph.D., Postdoctoral Researcher at NASA Jet Propulsion Laboratory
Research interests include extreme heat, atmospheric rivers, compound extreme events, and optimizing climate information for decision-making.
colin.raymond@jpl.nasa.gov
Radley Horton, Ph.D.
Lamont Associate Research Professor, Columbia University Earth Institute
Research interests include climate change and extreme weather, including impacts and resilience relating to extreme heat and heat with high humidity.
rh142@columbia.edu
Astrid Caldas, Ph.D.
Senior Climate Scientist, Union of Concerned Scientists
*Available for interviews in English, Spanish, and Portuguese
Media Contact: Ashley Siefert Nunes, Climate Communications Officer
ASiefert@ucsusa.org
METHODOLOGY
Hourly wet bulb temperature data was collected by researchers from Raymond et al. (2020), using 474 contiguous U.S. weather stations for this analysis. For humid heat extremes in each location, the change in frequency was found by calculating the value that happened (on average) on 5% of days in the 1980s and 1990s, and then seeing how often that happened in the 2000s and 2010s.
Related Media
July 4th Extremes
JUL 1, 2020
This week, we take a look at July warming and July 4th climate extremes.
Seniors at Risk: Heat and Climate Change
JUN 24, 2020
A new Climate Central report examines how heat and a warming climate endanger the health of an aging U.S. population, a threat made even more worrisome during the COVID-19 pandemic.
I will be listing some of Sunday’s “ET’s” listed in the space below:
Here is more climate and weather news from Sunday:
(As usual, this will be a fluid post in which more information gets added during the day as it crosses my radar, crediting all who have put it on-line. Items will be archived on this site for posterity. In most instances click on the pictures of each tweet to see each article. The most noteworthy items will be listed first.)
Now here are some of today’s articles and notes on the horrid COVID-19 pandemic:
(If you like these posts and my work please contribute via the PayPal widget, which has recently been added to this site. Thanks in advance for any support.)
Guy Walton… “The Climate Guy”