Wednesday April 8th… Dear Diary. The main purpose of this ongoing blog will be to track United States extreme or record temperatures related to climate change. Any reports I see of ETs will be listed below the main topic of the day. I’ll refer to extreme or record temperatures as ETs (not extraterrestrials).😉
Main Topic: Early April Record Scoreboard Update and Climatological Review
Dear Diary. As COVID-19 ravages the United States and the globe, climate change continues to be a simmering issue, which most news sources have put on the back burner of coverage because of the pandemic. On this site, though, the climate crisis will always make headlines, because it will be with us long after this pandemic abates.
So far this spring we have seen some truly eye opening warmth across the United States, but less so than during March 2012, which was the warmest March on record and truly astounding.
It’s that time of the month when NCEI has completed their assessment for the prior month, so I’m trotting out record scoreboard updates.
Here on this site we present monthly summaries near the 6th of each month, and each is available if you want to go back through my Extreme Temperature Diary archive.
I’m repeating my mantra from last month:
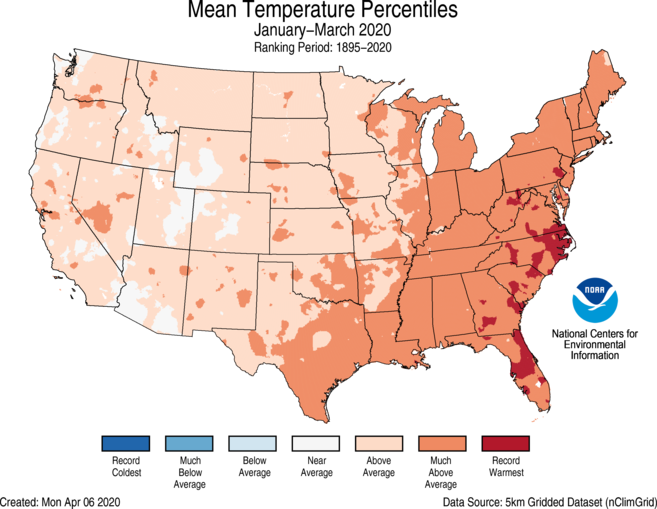
March 2020 got ranked by the National Center for Environmental Information as a well above average March, temperature wise, for the lower 48 states, coming in as 10th warmest or 117th coldest since records began being kept in 1895:
https://www.ncdc.noaa.gov/cag/national/rankings/110/tavg/202001
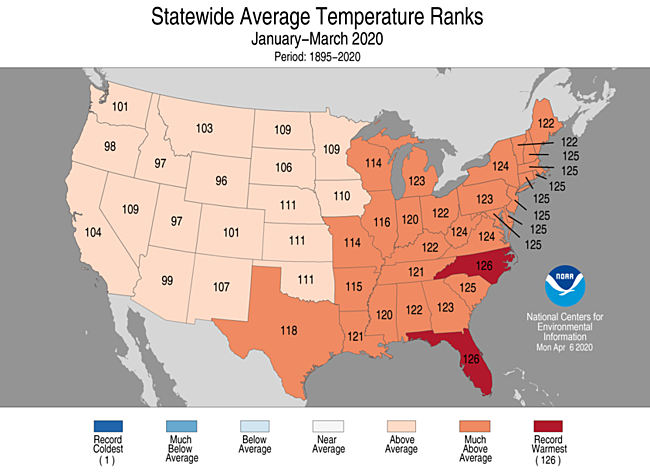
Here we see rankings for each state in the contiguous United States:
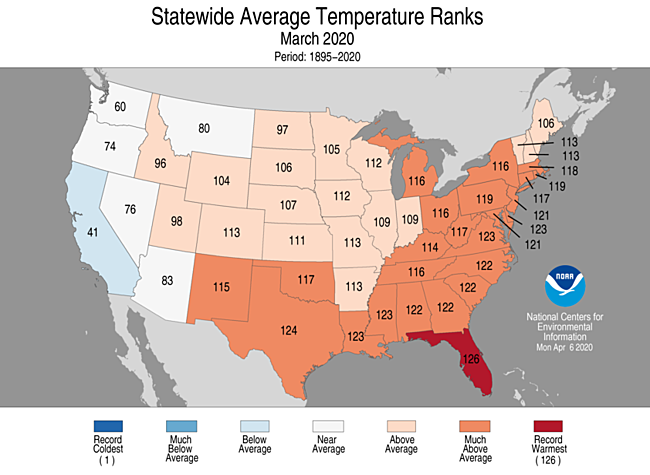
Florida saw its warmest March on record. Only one state, that of California, saw below average temperatures.
Here are my two U.S. Daily Record Scoreboards updated through 4/8/2020 (data compiled from the following NCEI site):
https://www.ncdc.noaa.gov/cdo-web/datatools/records


DHMX= Daily High Max Reports. DLMN= Daily Low Min Reports. DHMN= Daily High Min Reports. DLMX=Daily Low Max Reports.
For these data sets all monthly ratios of > 10 to 1 DHMX to DLMN or > 10 to 1 DLMN to DHMX are in bold type. The rankings are for the lower 48 states with the warmest ranking since 1895 of average temperatures being 125 and 1 being the coldest as of 2020. Blue colors represent cold months and red warm. Those months and years with counts close to a 1 to 1 ratio of highs to lows are colored black. Boldly colored months, such as January 2020, have ratios of more than 10 to 1 daily record highs to lows or lows to highs, and are either historically hot or cold, most of which have made news.
March 2020 had approximately a 4-1 ratio of record DHMX to DLMN individual record counts, so the color I used for this month was red on the top chart.
March 2020 had approximately a 4-1 ratio of record DHMN to DLMX individual record counts, so the color I used for this month was red on the bottom chart.
Due to climate change we will see less blue colors on these Record Scoreboards with time, and in the United States March 2020 was no exception.
We do have hints, as indicated by blue colors and ratios so far, that April 2020 could turn out colder than average. As discussed on this blog yesterday there will be a big weather pattern change by the middle of this month, probably leading to many more record cold reports than warm, adding to cool totals thus far. Check in next month to see if this forecast verifies.
As stated, the ranking for March 2020 was 117, which was colored red. I color rankings +10 or -10 from the average ranking of 63 black, indicating that these are near average temperature wise.
Here is much more detailed U.S. climatology as complied by NOAA:
https://www.ncei.noaa.gov/news/national-climate-202003
Assessing the U.S. Climate in March 2020
Two billion-dollar weather and climate disasters impact U.S. in first months of 2020

In the first three months of 2020, there were two weather and climate disaster events with losses exceeding $1 billion each across the United States. Both events were attributed to severe storms. The first severe weather event occurred across the South, Southeast and Great Lakes states in January causing tornadoes, flooding and coastal erosion. The second event occurred in March as tornadoes caused significant damage to the greater Nashville, Tennessee, area in addition to storm damage in surrounding states.
During March, the average contiguous U.S. temperature was 46.1°F, 4.6°F above the 20th-century average. This ranked as the 10th warmest March in the 126-year period of record. The year-to-date (January-March) average contiguous U.S. temperature was 39.3°F, 4.1°F above average, ranking eighth warmest on record. The March precipitation total for the contiguous U.S. was 2.83 inches, 0.32 inch above average, and ranked in the wettest third of the 126-year period of record. The year-to-date precipitation total was 8.02 inches, 1.06 inch above average, tying with 1937 as the 14th wettest January-March on record.

This monthly summary from NOAA National Centers for Environmental Information is part of the suite of climate services NOAA provides to government, business, academia and the public to support informed decision-making.
March Temperature
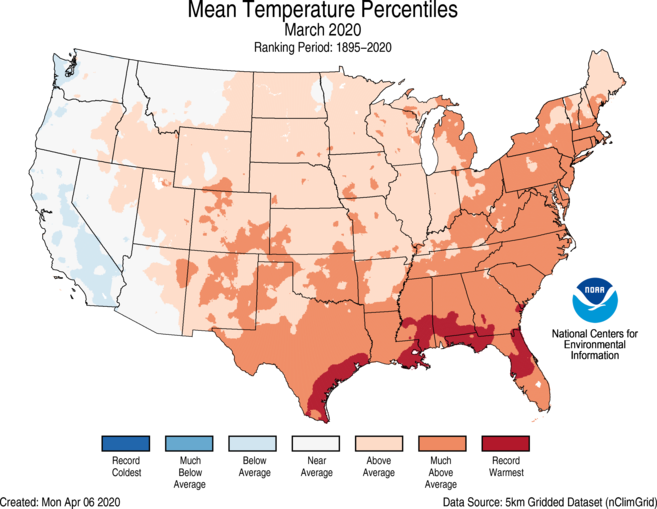
- Above-average temperatures were observed from the Rocky Mountains to the East Coast. Record warmth was observed across most of the Gulf Coast, and contributed to the warmest March on record for Florida. Seventeen additional states from Texas to New England experienced a top-10 warm month.
- California ranked cooler than average with five additional Western states ranking near average for the month.
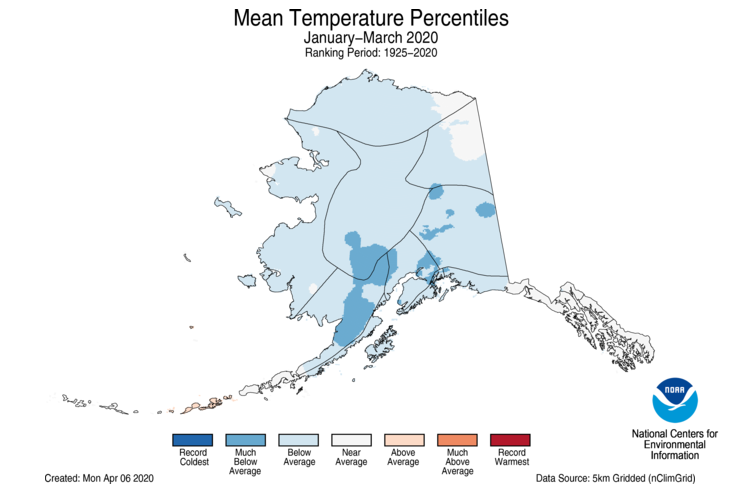
- The Alaska March temperature was 11.9°F, 1.1°F above the long-term average. This ranked in the middle third of the 96-year period of record for the state and was the coldest March since 2017. On average, the North Slope, West Coast, northern portions of the Northeast Interior and the Aleutians had above-average temperatures during March. Below-average temperatures were felt from Cook Inlet to the Panhandle.
- Bering Sea ice cover was above average in early March, but southerly winds pushed warmer water as well as warmer air temperatures into the region, causing more than 77,000 square miles of thin ice to melt. This was the largest drop in Bering Sea March ice extent on record, albeit similar in magnitude to March 2002.
March Precipitation
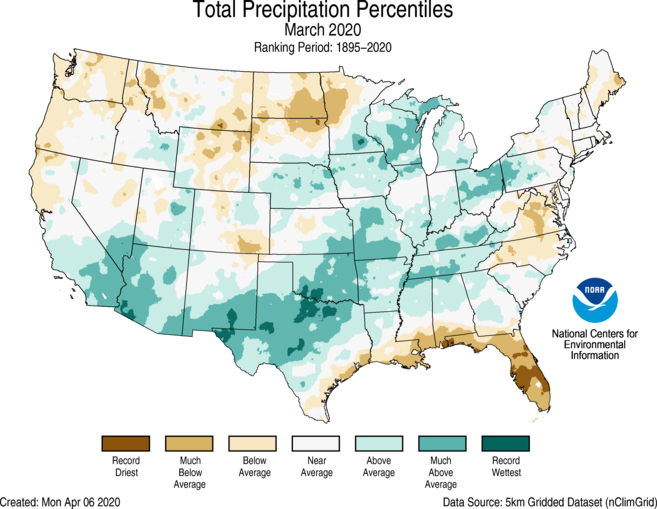
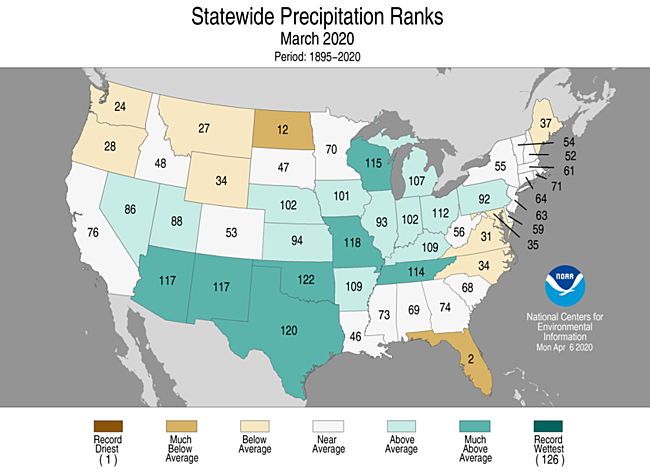
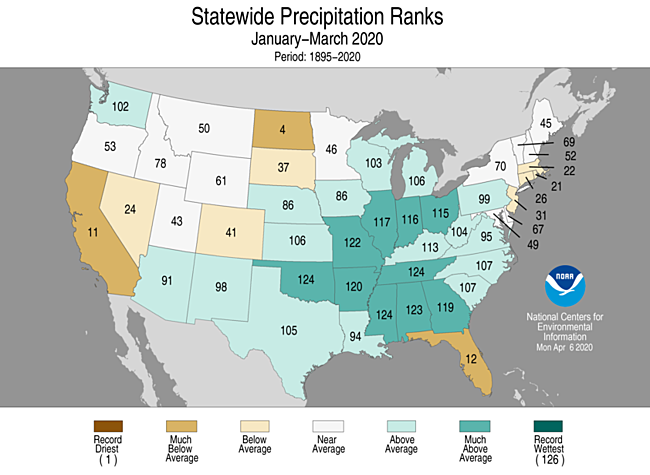
- Above-average to record precipitation was observed from parts of the Southwest to Texas and up into the Great Lakes. Oklahoma ranked fifth wettest while Texas ranked seventh wettest for the month. Portions of southern California received some much needed rainfall during the month, although relief came in the form of flash flooding, which also extended into other parts of the Southwest.
- Below-average precipitation was observed across parts of the Northwest, Northern Tier, Gulf Coast, Mid-Atlantic and Northeast. Florida ranked second driest for March while North Dakota ranked 12th driest.
- Precipitation was above average across much of mainland Alaska during March.
- Denali Park Headquarters had its snowiest four-day March period on record with 32.6 inches on March 23-26.
- The snow course measurement at Fielding Lake in the east-central Alaskan Range recorded its greatest snow depth and water equivalent in any month over the last 60 years.
- The northerly track of the storm systems causing the wet pattern across the mainland of Alaska also produced below-average precipitation across much of the Panhandle. Kodiak had its driest March on record with only 0.19 inch of precipitation, breaking a 0.40-inch record set in 1918.
- According to the March 31 U.S. Drought Monitor report, 14.5 percent of the contiguous U.S. was in drought, up from 11.5 percent at the beginning of March. Drought conditions intensified and expanded across California, Oregon, Washington, Nevada and much of the Gulf of Mexico coast. Record temperatures and near-record dryness across Florida during March led to flash drought development across the state.
Year-to-Date (January-March)
Billion-Dollar Weather and Climate Disasters

- From January 10-12, parts of the South and Southeast from Texas to Virginia and parts of the Midwest experienced severe weather and flooding, causing significant damage. More than 80 tornadoes were reported in addition to widespread flooding across the Southeast. Coastal communities across portions of the Great Lakes experienced damaging storms, severe flooding and coastal erosion due to high lake levels and very little seasonal ice cover.
- Overnight tornadoes across Tennessee and the greater Nashville area on March 2-3 caused more than 40 buildings to collapse and left a trail of destruction across northern Nashville and some of the surrounding communities. More than two dozen fatalities were reported across the region. On March 4, there was also hail and windstorm damage across Mississippi, Alabama, Kentucky and Missouri.
- In April 2020, NCEI added five historical weather and climate events which, through inflation and review, surpassed the billion-dollar threshold. The U.S. has now sustained 265 weather and climate disasters since 1980 where overall damages/costs reached or exceeded $1 billion (based on Consumer Price Index adjustment to 2020). The total cost of these 265 events exceeds $1.775 trillion.
Year-to-Date (January-March) Temperature

- Above-average temperatures blanketed much of the Lower 48 with much-above to record warmth across the eastern half of the contiguous United States. North Carolina and Florida ranked warmest on record for the first three months of the year with eight additional states from South Carolina to New England ranking second warmest for this January-March period.
- The Alaska January-March temperature was 2.4°F, 3.5°F below the long-term average, the 16th coldest on record for the state and coldest such year-to-date period since 2012. Below- to much-below average temperatures blanketed most of the interior portions of the state during the first three months of 2020. Only a small portion of the Aleutians ranked above average during this time.
- The cold season (October-March) across Alaska was the coldest such season in the last seven years with an average temperature of 10.8°F, 1.0°F above average.
Year-to-Date (January-March) Precipitation

- Above-average precipitation stretched from parts of the Southwest, across the Southeast, and into the Great Lakes. Oklahoma, Mississippi and Tennessee ranked third wettest for this three-month period.
- Below-average precipitation was observed across portions of the West, central Rockies, northern Plains, Gulf Coast and New England. North Dakota ranked fourth driest for the first three months of the year, with California eleventh driest and Florida twelfth driest.
- Just one month into the spring (March-May), Fairbanks, Alaska, has already experienced its snowiest spring since 1967 and seventh snowiest spring in the last 106 years.
- It was the wettest January-March for San Juan, Puerto Rico — 21.62 inches — 6.39 inches greater than the previous record set in 2010.
See all March U.S. temperature and precipitation maps.
Now, here are some of todays articles on the horrendous coronavirus pandemic:
Here is more climate and weather news from Wednesday:
(As usual, this will be a fluid post in which more information gets added during the day as it crosses my radar, crediting all who have put it on-line. Items will be archived on this site for posterity. In most instances click on the pictures of each tweet to see each article.)
Here are some “ET’s” from Wednesday:
(If you like these posts and my work please contribute via the PayPal widget, which has recently been added to this site. Thanks in advance for any support.)
Guy Walton “The Climate Guy”