Monday December 9th… Dear Diary. The main purpose of this ongoing blog will be to track United States extreme or record temperatures related to climate change. Any reports I see of ETs will be listed below the main topic of the day. I’ll refer to extreme or record temperatures as ETs (not extraterrestrials).😉
November and Early December Record Scoreboard Updates and Climatological Review
Here on this site we present these monthly summaries near the 8th or 9th of each month if you want to go back through my Extreme Temperature Diary archive.
November 2019 saw more Arctic outbreaks in the Midwest, Rockies and East where over 5,300 daily cold records were either tied or set. We did not see much significant warmth except along the West Coast and for a few days in Alaska. Even though the world is warming overall, once again in November the U.S. had below average temperatures.
November 2019 got ranked by the National Center for Environmental Information as a below average November, temperature wise, for the lower 48 states coming in as 48th coldest or 78th warmest since records began being kept in 1895:
https://www.ncdc.noaa.gov/cag/national/rankings/110/tavg/201911
Here we see rankings for each state in the contiguous United States:
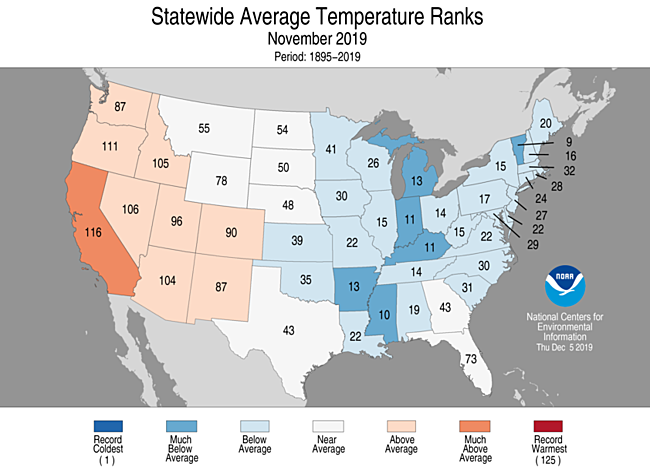
Very cold conditions penetrated into the mid South due to one tremendous Arctic outbreak during the middle of the month while the West Coast saw mild to warm temperatures.
Here are my two U.S. Daily Record Scoreboards updated through 12/7/2019 (data compiled from the following NCEI site):
https://www.ncdc.noaa.gov/cdo-web/datatools/records


DHMX= Daily High Max Reports. DLMN= Daily Low Min Reports. DHMN= Daily High Min Reports. DLMX=Daily Low Max Reports.
For these data sets all monthly ratios of > 10 to 1 DHMX to DLMN or > 10 to 1 DLMN to DHMX are in bold type. The rankings are for the lower 48 states with the warmest ranking since 1895 of average temperatures being 125 and 1 being the coldest as of 2019. Blue colors represent cold months and red warm. Those months and years with counts close to a 1 to 1 ratio of highs to lows are colored black. Boldly colored months, such as May 2018, have ratios of more than 10 to 1 daily record highs to lows or lows to highs, and are either historically hot or cold, most of which have made news.
November 2019 had a near 1-4 ratio of record DHMX to DLMN individual record counts, so the color I used for this month was blue on the top chart.
November 2019 had a near 1-4 ratio of record DHMN to DLMX individual record counts, so the color I used for this month was blue on the bottomt chart.
Due to climate change we will see less blue colors on these Record Scoreboards with time, but in the United States November 2019 was another exception.
The year 2019 has not been particularly warm, average temperature
wise, across the United States either. I’m hoping that this “nothing burger” won’t be used to delay climate mitigation, but the cold weather certainly won’t spur everyone to action. Also, looking at the record scoreboards there has been a cooling trend since 2016. I wonder how long that will last going into the 2020s?
As stated, the ranking for the month was 48, which was colored blue. I color rankings +10 or -10 from the average ranking of 62 black indicating that these are near average temperature wise.
December 2019 has gotten off to a near average with relatively few record reports to start out the month.
So far, the U.S. has seen a near average 2019 looking at temperatures and record counts, but we may be experiencing one of the last “tolerable” years, temperature wise, in the face of global warming. Certainly we are beginning to see more extreme warmth, and yes chill. We will see if this chart changes much for 2019 through the end of this year:

In Alaska and for Fall 2019 in general:
December numbers and assessments should prove interesting in light of the fact that we will be wrapping up climatology for the 2020s, so stay tuned to this website for updates.
Here is more climate and weather news from Monday:
(As usual, this will be a fluid post in which more information gets added during the day as it crosses my radar, crediting all who have put it on-line. Items will be archived on this site for posterity. In most instances click on the pictures of each tweet to see each article.)
Here are “ET’s” set today from Alaska:
(If you like these posts and my work please contribute via the PayPal widget, which has recently been added to this site. Thanks in advance for any support.)
Guy Walton- “The Climate Guy”