Friday March 12th… Dear Diary. The main purpose of this ongoing post will be to track United States extreme or record temperatures related to climate change. Any reports I see of ETs will be listed below the main topic of the day. I’ll refer to extreme or record temperatures as ETs (not extraterrestrials).😉
Mid April U.S. Temperature And Record Scoreboard Update
The last year of the 2010s has certainly gotten off to a cold start across most of the U.S. looking at temperature data. Record wise, at least through 4/12, March 2019 had the highest ratio of daily record lows to highs since April 2014 with the number of reported cases of daily record lows far exceeding that of daily record highs across the United States. I can tell Midwesterners buried in snow and who have been facing record cold at times this winter and now spring that global warming certainly has not ended. Residents of the Midwest just had the bad luck of being on the receiving end of a one-two…and now three punch from Wesley of a persistent storm track combined with extensions of the polar vortex diving southward through the Great Lakes. For today’s main topic we will look at more numbers, which I have plugged into the “Record Scoreboard.” We have been doing this during the middle of each month. Here is what we see after the 4/3/19 NCEI update:
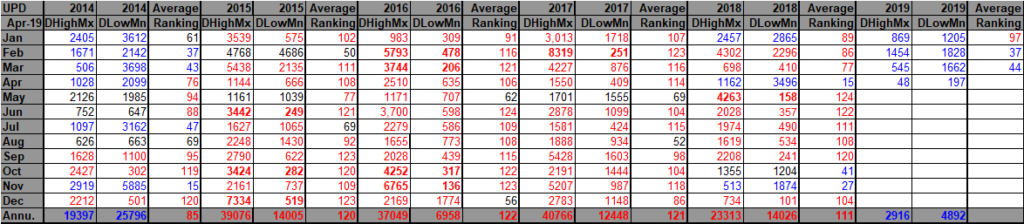
There have been relatively few reports of records for April 2019, but the trend continues for this year of more record lows than highs for the current month. I was not expecting another year similar to 2014 given the current state of global warming and a strengthening El Nino, but nevertheless; it looks like we could see four consecutive “blue” months to start out the year as seen five years ago. I’ve plugged in the ranking number of 44 indicating that the lower 48 states had its 44th coldest March on record, colder than near average but not historically cold.
For this data set all monthly ratios of > 10 to 1 DHMX to DLMN or > 10 to 1 DLMN to DHMX are in bold type. The rankings are for the lower 48 states with the warmest ranking since 1895 of average temperatures being 125 and 1 being the coldest as of 2019. Blue colors represent cold months and red warm. Those months with counts close to a 1 to 1 ratio of highs to lows are colored black. Boldly colored months, such as May 2018, have ratios of more than 10 to 1 daily record highs to lows or lows to highs, and are either historically hot or cold. February 2018 had a near 1 to 1 ratio of record DHMX to DLMN individual counts, so the color I used for this month was black.
Here is some more climate and weather news from Friday:
(As usual, this will be a fluid post in which more information gets added during the day as it crosses my radar, crediting all who have put it on-line. Items will be archived on this site for posterity. In most instances click on the pictures of each tweet to see each article.)
(If you like these posts and my work please contribute via the PayPal widget, which has recently been added to this site. Thanks in advance for any support.)
Guy Walton- “The Climate Guy”