Wednesday March 28th… Dear Diary. The main purpose of this ongoing post will be to track United States extreme or record temperatures related to climate change. Any reports I see of ETs will be listed below the main topic of the day. I’ll refer to extreme or record temperatures as ETs (not extraterrestrials)😊. Here is today’s main climate change related topic:
Alaska Record Trends
Last year I endeavored to look at Canadian and Russian record counts in the National Center for Environmental Information’s Surface Record site to see if there was an appearance of more rapid warming from carbon pollution at higher latitudes. It occurred to my addled brain that I neglected to investigate an area of the United States isolated at high latitudes, Alaska. Thankfully, the NCEI site has the ability to process record counts by state, so it was a fairly easy job to plug data in to my simple Excel files for processing. I came up with some interesting if not unexpected preliminary findings for this decade.
First, here are the record number counts within the state of Alaska (ties, as usual, are included):
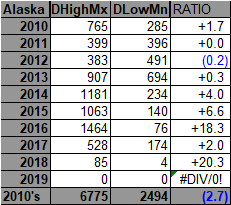
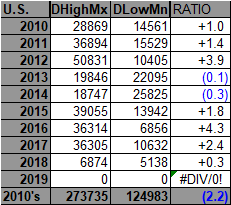
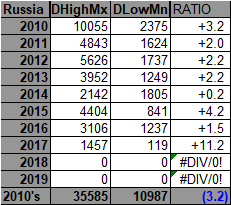
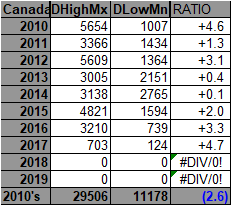
The big take away here is that the ratio of daily high maxes to daily low minimums for this decade is 2.7 to 1 so far this decade in Alaska as opposed to 2.2 to 1 for the U.S. as a whole, so indeed we once again via record counts see more warming at higher latitudes than lower. The Alaska ratios are similar to those of Canada and Russia:
Next let’s put this data into bar graph form:
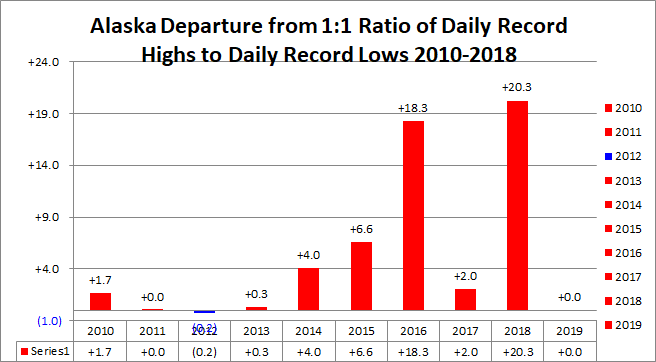
As expected just about every year had more record high counts than lows. I have suspected that the near record warm El Nino of 2015-2016 had a big influence on extreme temperatures, and this appears to be the case even at high latitudes. It’s interesting that while the lower 48 states were baking during the warmest year in recorded history in 2012 Alaska had its coldest year so far this decade. I suspect that the cold polar vortex took up residence over Alaska in 2012 without making many southern swings unto the lower 48 states. The jury, of course, is still out in 2018, but this year has gotten off to a warm start in Alaska. These record ratios match up well with average departures for Alaska for the 2010s:

2010: +1.4F
2011: +1.0F
2012: -1.7F
2013: +1.8F
2014: +4.3F
2015: +4.0F
2016: +5.9F
2017: +3.3F
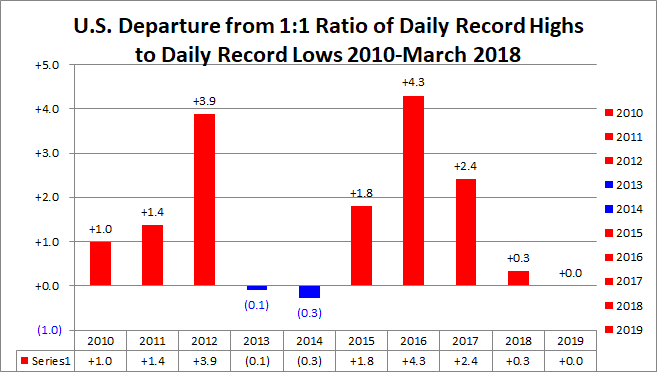
For comparison, here is the same chart for the United States:
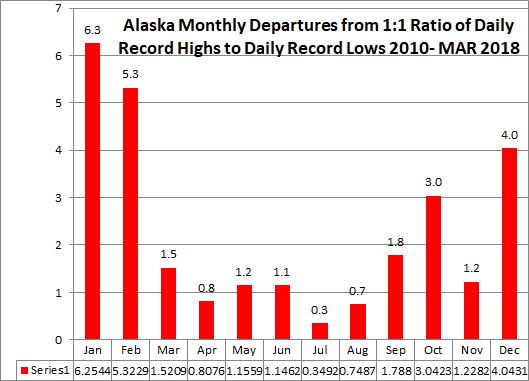
Next let’s flip the Alaska chart around, which shows more daily record maxes being set during the cold months than in warm months, another interesting finding:
Lastly, let’s look at individual monthly record counts during the 2010s. I’ve prepared an Alaskan “Records Genome” for this purpose:
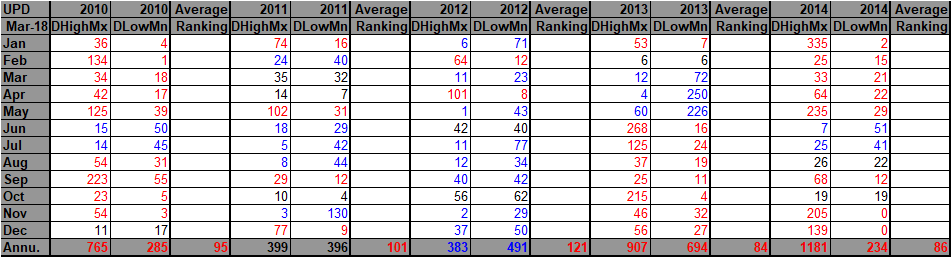
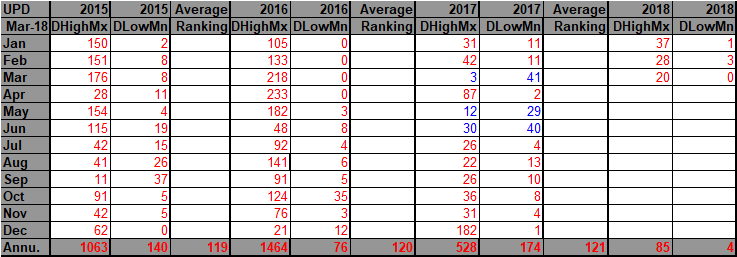
While the U.S. as a whole was going through a 37 month record long streak of more record DHMX than DLMN from DEC 2014- DEC 2017 Alaska was relatively warm, as well. Note that there were no record lows recorded at all from DEC 2015-APR 2016 in Alaska, which is a rather large territory.
I will be adding more pertinent data to this post later this week once I get Alaska data processed from 1920-2010.
The Climate Guy