Monday March 12th… Dear Diary. The main purpose of this ongoing post will be to track United States extreme or record temperatures related to climate change. Any reports I see of ETs will be listed below the main topic of the day. I’ll refer to extreme temperatures as ETs (not extraterrestrials)😊. Here is today’s main climate change related topic: (If you like these posts and my work please contribute via the PayPal widget, which has recently been added to this site. Thanks in advance for any support.)
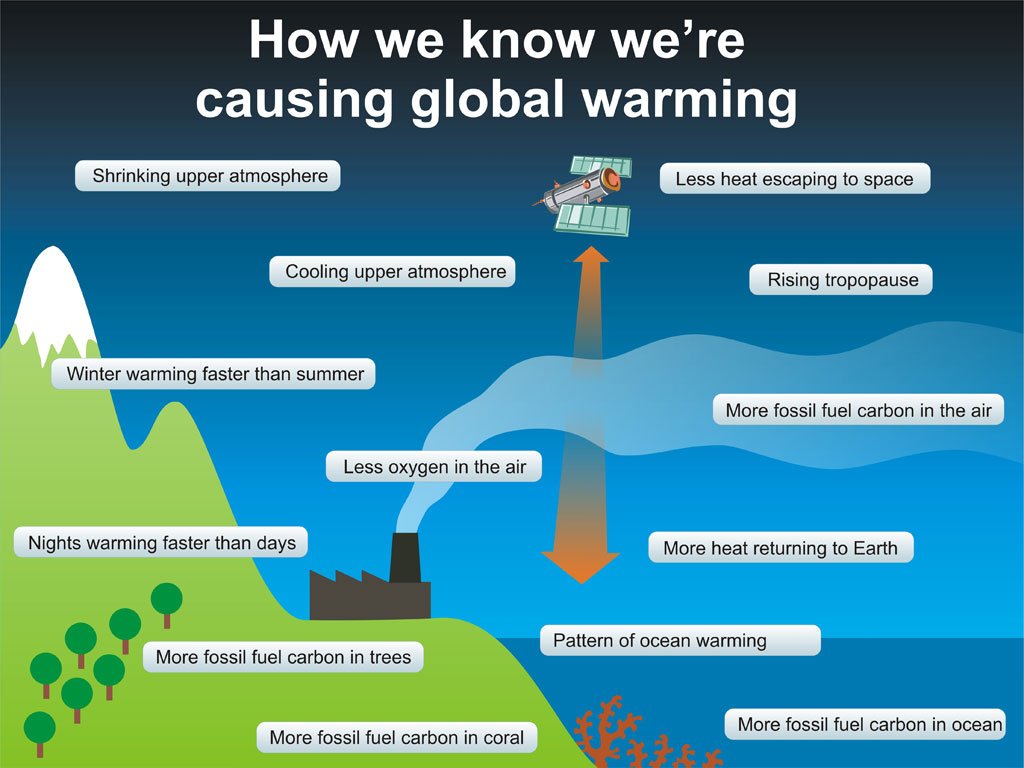
Simple Climate Change Graphic
All should know by now that what peaks my interest and attention are simple graphics relating some fairy complicated climate change science for public consumption. I find that those that don’t have a strong educated background in science can be more easily confused, as is the case in my own family, so a simple picture summarizing findings can be very helpful in what has become a big political battle to get enough people to sign off on mitigation policy in order to avert eventual world-wide catastrophe. Voila. I saw this on social media over the weekend: