Thursday November 30th… Dear diary. Here is today’s climate change related topic.
It’s not only been warm across much of the U.S this November but now a monster “heat wave” has hit Greenland:
“It’s been unusually warm in the United States in recent days, with records being set across the country. But it’s been scorching in Greenland, with temperatures as much as 54° above normal, which means above freezing in many places.”
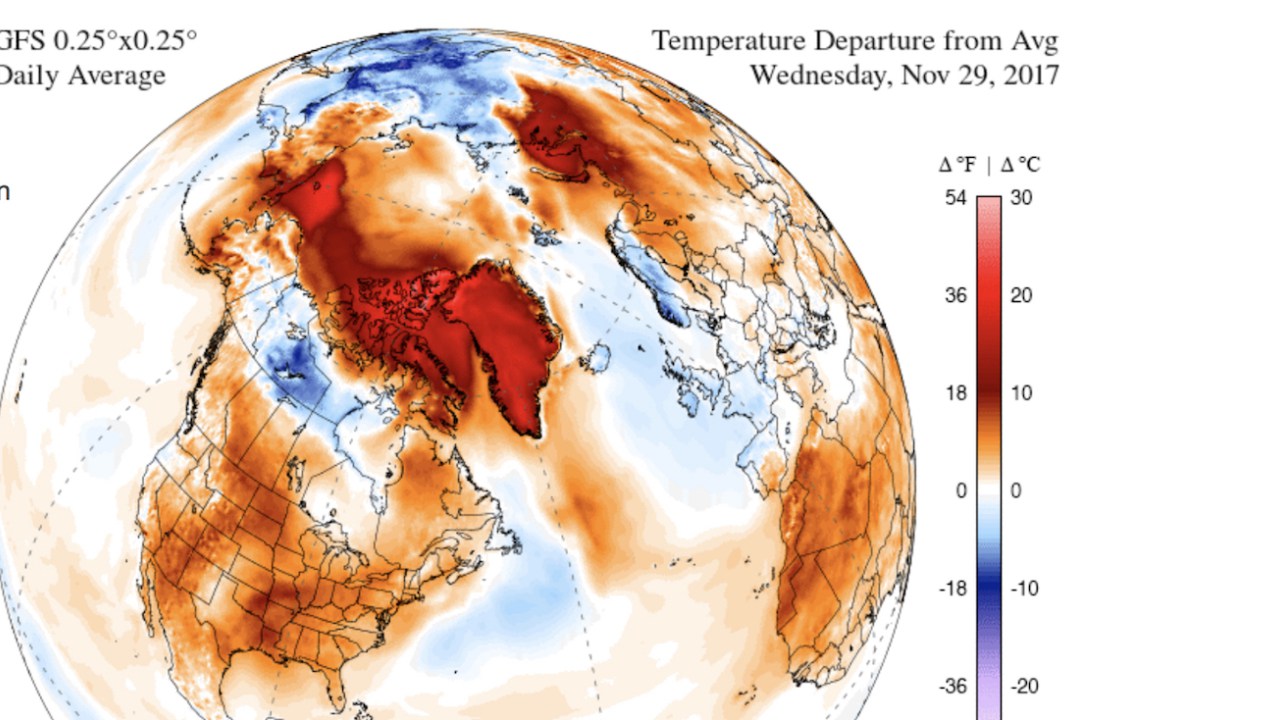
The warmth is interfering with typical fall refreezing of Greenland’s ice sheet. Should such weather patterns become more common sea levels will rise faster as forecast due to water spilling into the Atlantic from Greenland melting glaciers.
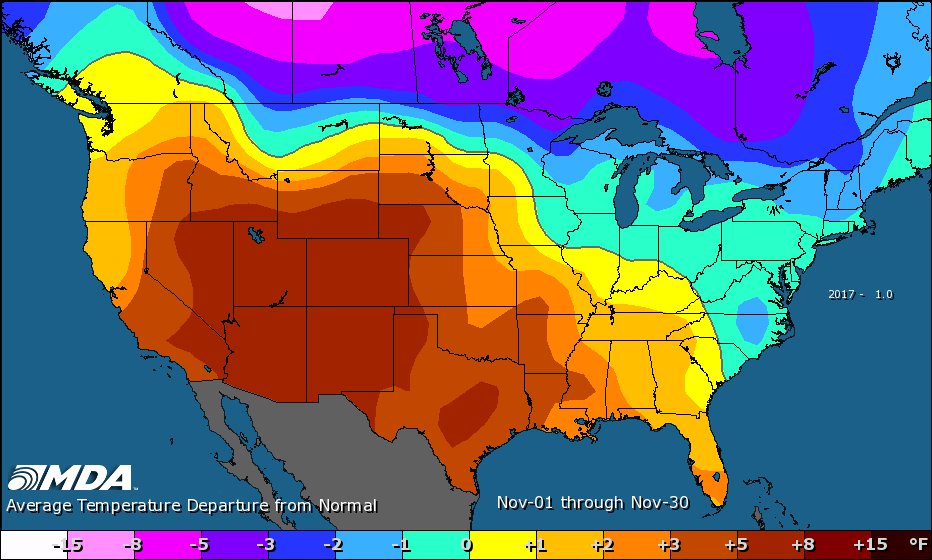
We are now seeing some good indications of just how significant the late November warm spell has been across the U.S. looking at record numbers from the NCEI database. The warm spell began in the West roughly on November 22nd. Here is what I see from 11/22 to 11/27 (latest updates in the database):
1562 DHMX 1298 DHMN 11 DLMX 23 DLMN or 2860 warm records vs. only 34 cold records
Yikes! And the warm spell isn’t done yet. I’ll finalize these numbers once the warm spell ends after the first week of December.
November 2017 will definitely go down as the 36th consecutive month (three full years) of more DHMX than DLMN in the NCEI database:

That “heat wave” in Greenland will ironically boost the negative North Atlantic Oscillation thereby putting an end to warmth across most of the U.S. Here is one of the latest operational models showing a cold anomaly trapped beneath both the NAO ridge across Greenland and the western and northern Canadian ridge or positive anomaly:
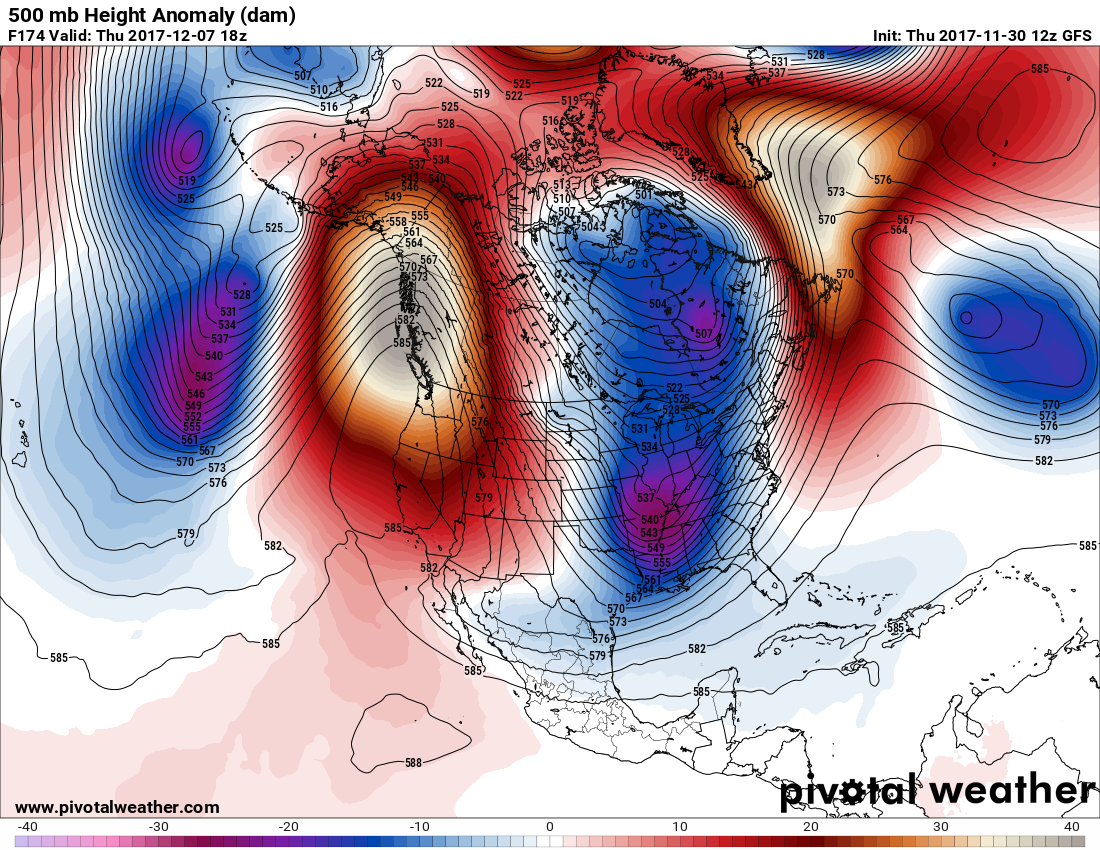
Models have been consistent indicating that 12/6 will be a transitional day then 12/7 will be the day when cold air really takes a lounge through the Midwest and South. Any record cold? Perhaps, but I’m not too impressed so far.
The Climate Guy
Wednesday November 29th… Dear Diary. Here is today’s climate change related topic:
Last week we delved into what would be more environmentally friendly, getting products and gifts on-line or from brick and mortar stores. There were no easy answers. BTW thanks for such a good response on that topic. Today I will present a couple of lifestyle options which are more scientifically cut and dry on the eco-friendly issue.
First, as an old Wendy’s commercial once said, where’s the beef? Or in this case if one is not a vegetarian, which meats, when produced, emit less carbon into the atmosphere? The answer is obvious from this chart:
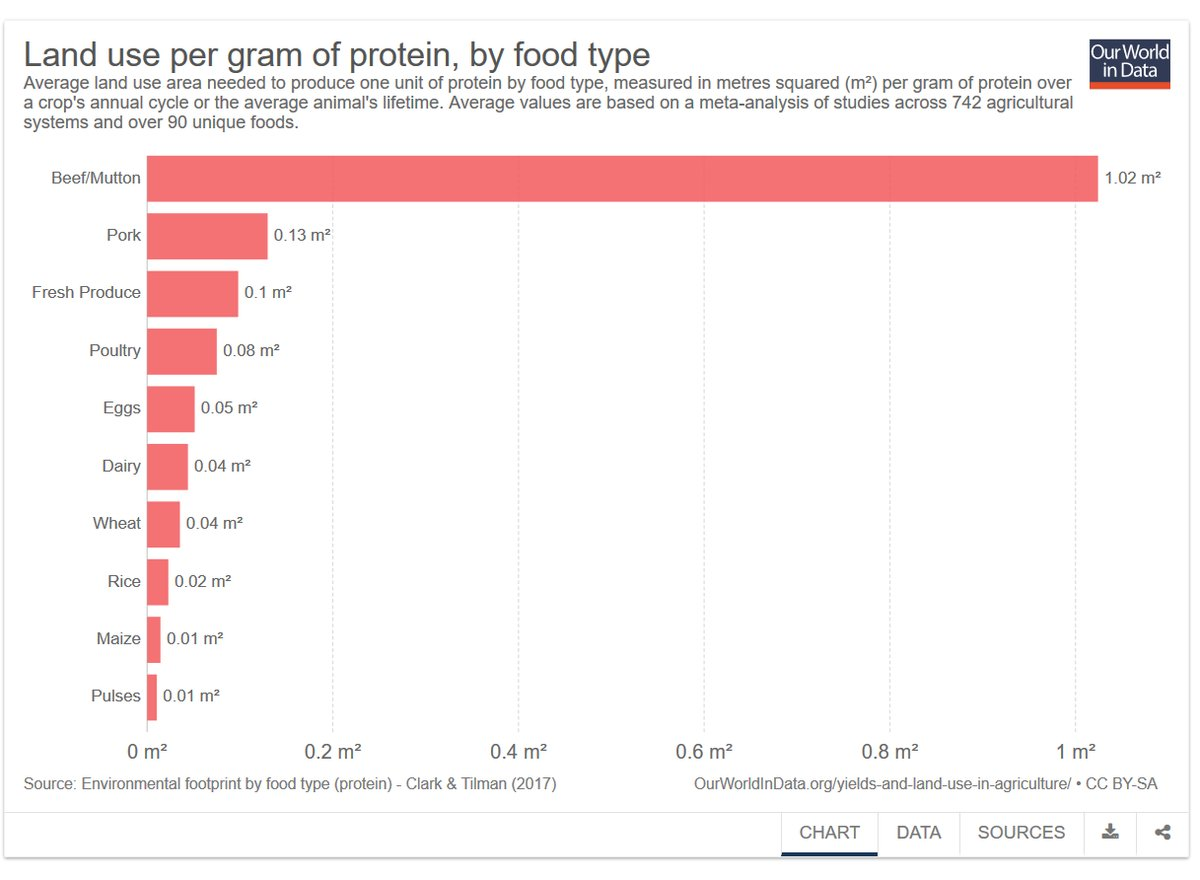
Beef and lamb production uses more land and thus emits more carbon into the atmosphere when produced.
Next I offer a chart from Dan Neuman that is pretty clear-cut when it comes to carbon emitted from transportation:
 I know it might be highly inconvenient, but if possible next time on a long trip take a train.
It is becoming very clear that a big weather pattern change will occur after the first few days of December such that the East and Plains will get very cold. The big question as far as this blog goes is will the cold regime produce many records? Looking at 500 millibar heights and 850 Mb temperatures probably not initially, but if the pattern can persist deeper into the winter season while building up snow cover perhaps. In the age of high global warmth those are big ifs. Here is what I am seeing at 192 hours out during the first day once the pattern change takes place:
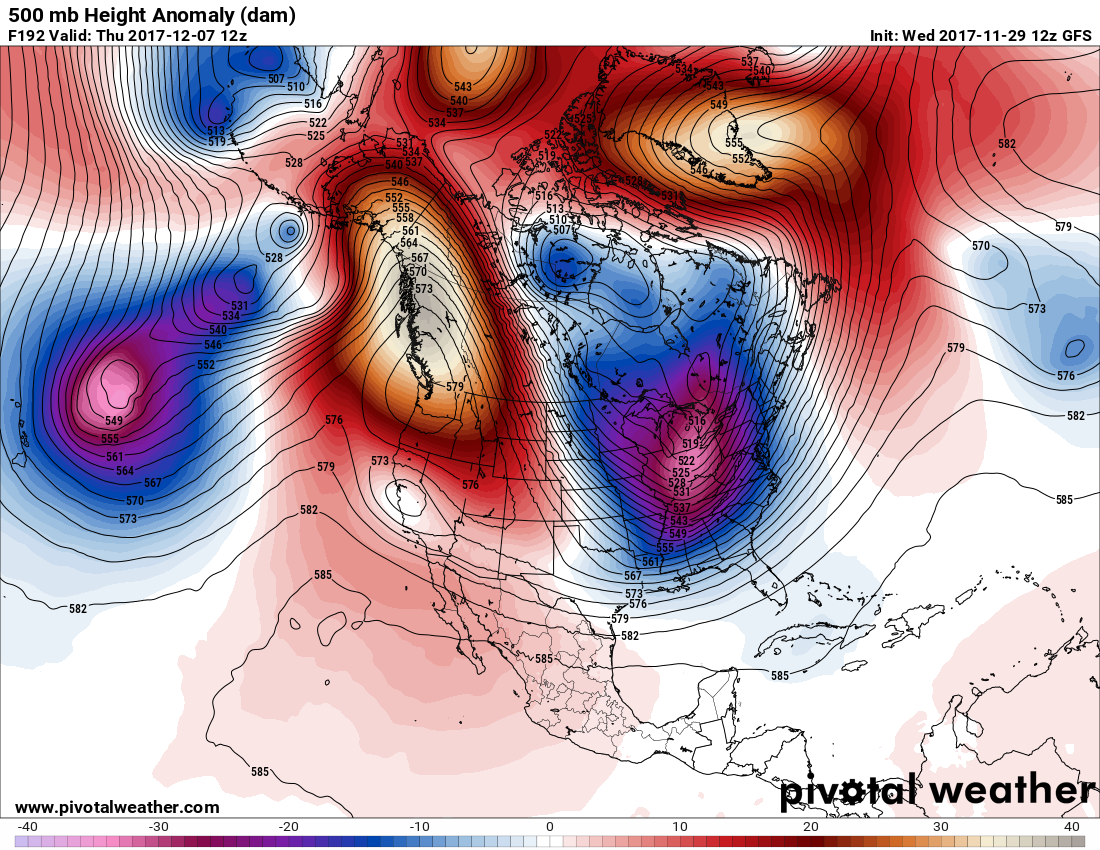
In my 30+ years as a meteorologist I have seen much deeper troughs in the East in early December than what is forecast. The ridge in the West is pretty impressive, which may produce yet more record warmth there. I’m very impressed with the positive anomalies from the West northward through Canada into Alaska and in Greenland, which should lock in the cold pattern in the East for at least one week.
From MDA Weather Services: “At this point November is a lock to be the warmest on record for many spots in the Southwest including Phoenix, Vegas, Tucson, Salt Lake City. Meanwhile most major cities in the Midwest/East end up near to slightly below normal.”
I’ll add to this post if any relevant information crosses my radar later today.
The Climate Guy
Tuesday November 28th… Dear Diary. Here is today’s climate change related topic:
We’ve known for many decades that strong volcanic eruptions temporarily cool the Earth if their aerosols, or ash and soot, reach stratospheric levels thereby spreading globally blocking incoming solar radiation. A new eruption in Indonesia from Mount Agung may just do that (from Eric Haltheus):
http://grist.org/briefly/high-rent-no-health-care-young-farmers-theyre-just-like-us/
From the Article: “Should the eruption escalate, it could have worldwide climate implications, including temporarily cooler temperatures. In 1815, the eruption of nearby Mount Tambora altered weather patterns worldwide, leading to crop failures in Europe and the infamous 1816 “year without a summer” believed to be the inspiration for Mary Shelley’s novels Frankenstein.
Agung very likely won’t become a Tambora-scale disaster, but its ash and gas emissions could still block some of the sun’s rays for the next year or two. After that, however, the global climate will continue to behave as if the eruption had never happened.”
The last major eruption to significantly cool the planet was Mt. Pinatubo in 1991. There was noticeable cooling from 1992-1994. The danger here is not from any welcome cooling but from humanity becoming complacent during any short term period of worldwide decreased temperatures. I remember during my time at The Weather Channel people poo-poing global warming science during the early 1990’s due to cold weather from the eruption of Mt. Pinatubo. Climate change denialists will probably do the same should the eruption of Mt. Agung be similar.
It’s still debatable if the eruption of Mt. Agung will be that significant. I saw this NASA chart information from a tweet today by Rob Ellington:
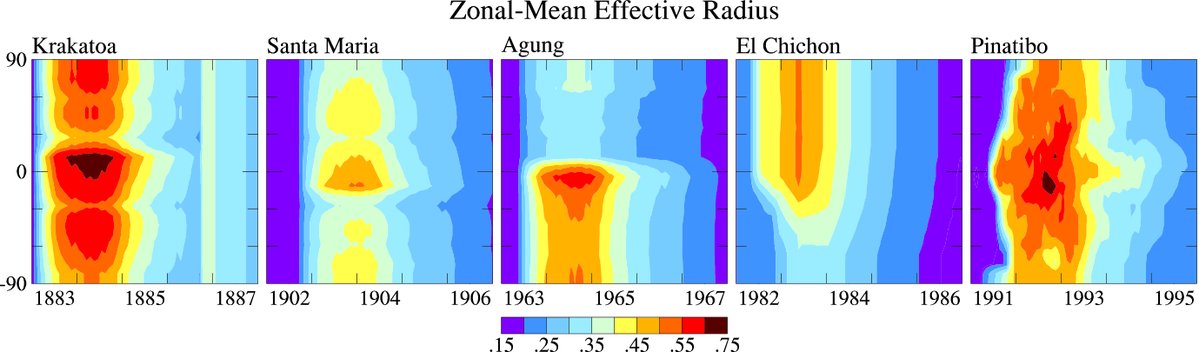 The prior eruption from Mt. Agung in 1963 did not have significant global effects compared to the other eruptions on the chart.
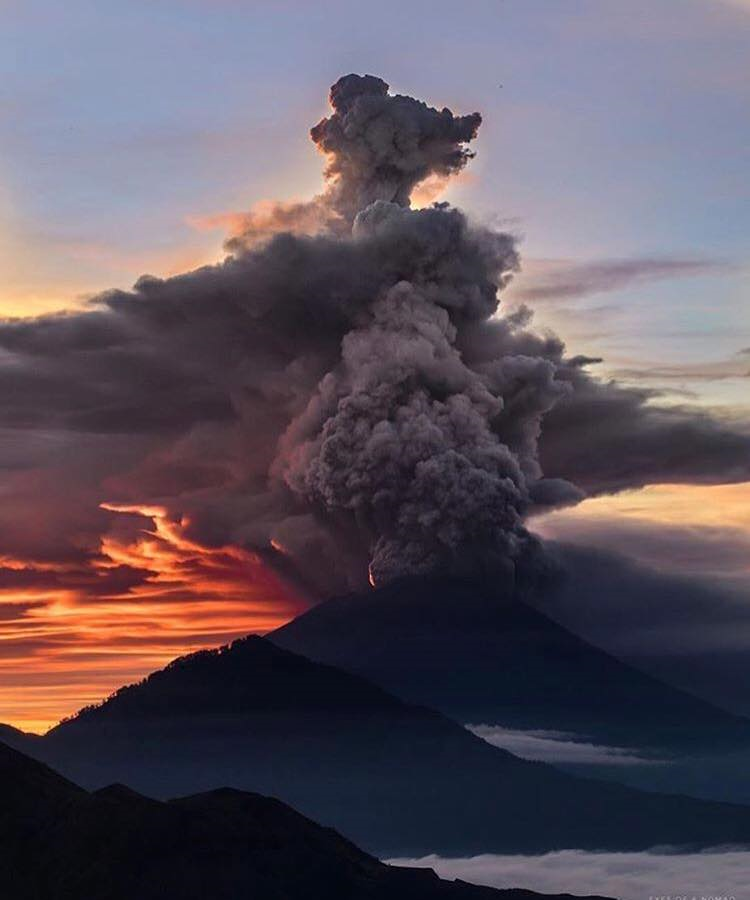
Here is a beautiful shot of the current eruption of Mt. Agung (image credit @rhysuhlich):
Speaking of cooling there are finally signs of a cold pattern developing for the eastern half of the country within my rule of thumb 240 hour out period on the meteorological models (any model past 240 hours is pretty much garbage). The atmosphere tried to close off a strong vortex south of Hudson Bay due to a negative North Atlantic Oscillation and western U.S. and Canadian ridge earlier this month, which didn’t happen. We’ll see if we get a similar pattern like what is depicted here on this mornings European model after the first week of December:

This article from my friend Jason Samenow of the Washington Post is a great summary of both records and the warmth that has been occurring across the nation:
Here are some record statistics from the article:

I’ll add more information in association with U.S. record temperatures should it cross my radar later today.
The Climate Guy