Thursday July 6th… Dear diary. The upper ridge in association with the western heat wave will have its first peak today. The West may get a brief respite from extreme heat as the ridge weakens allowing some dusty monsoon storms to develop, but the heat will remain dangerous across a broad area as stated yesterday through at least the 15th.
Tomorrow the extreme heat will shift farther west into California and the Pacific Northwest:

Notice that Vegas and Phoenix will only be a few degrees below their highest readings that occurred during the first southwestern heat wave in June.
Now let’s look at a few graphics depicting how serious the current heat wave is along with some safety tips.
Here is one from the NWS San Diego:

And another from the NWS Phoenix:

And one more from the NWS Salt Lake City:

Speaking of Utah, that Salt Lake City record of 105 yesterday ranks right up there amongst the hottest readings ever recorded at that city according to MDA Weather Services:

The maxes for today were close to records from interior portions of the Pacific Northwest southward through the Great Basin into the Southwest. Salt Lake City, we are closely watching, maxed out at 102:

To see all 2017 heat diary entries click: https://guyonclimate.com/category/heatdiary2017/
The Climate Guy
____________________________
Wednesday July 5th… Dear diary. The third heat wave for this season has already begun in the West. Let me summarize what the meteorological tea leaves are telling me at this point in time.
- Near record heat will persist at many locations from the Rockies to the West Coast at least through 7/15.
- Around 7/13 dangerous heat will spread eastward into the Plains and South and may persist for a few days.
- Monsoon storms could ignite fires in portions of the West but bring very little relief to above average heat.
- Due to position of long wave trough over North America area from Great Lakes eastward to much if the Northeast should be spared from a heatwave through 7/15.
Now let’s look at those current meteorological tea leaves to see why I have come up with these conclusions. The western ridge should pulse and oscillate in strength from 594-599 decameters being anchored near or over Utah and Colorado through at least 7/15 looking at ensembles:

Notice on the above chart valid on 7/14 that ensemble members have the center of the ridge over Utah and Colorado allowing for easterly flow into the Southwest; thus there should be what is termed a “monsoon” flow allowing for some dusty storms to develop. The stronger the ridge is, however, the fewer the storms will be due to suppression dynamics. Ridges tend to put a lid on thunderstorm development. Also the chart indicates that the ridge should be expanding into the Plains along with its associated heat. Here is the latest operational GFS 850 Mb chart valid for 7/15:

Extremely high temps are forecast in every area of the West spreading into the western Plains except in Washington and Oregon.
Why will much if the Great Lakes and Northeast be off the hook for extreme heat? I often harp on the strength of an area of cold low pressure aloft that typically resides north of Hudson Bay as a gage to how hot it will be across the CONUS during the summer months. If the low gets dislodged and gets parked closer to Greenland the lower 48 states has a hot summer. If it is fairly strong and gets anchored near or south of Hudson Bay, conditions across the U.S. will be relatively cool. As far as this July goes, we have a situation that is in between the hot or cool scenario. Here is a chart valid for the 14th indicating that there will be yet another cooling system moving into the Great Lakes and Northeast, but not strong enough to put a kibosh to the western and Plains heat wave:

Of immediate concern is the intensity of the western heat. Here are the forecast maximum values for tomorrow the 6th:

Yes, lower elevations across the West will be dangerously hot on Thursday.
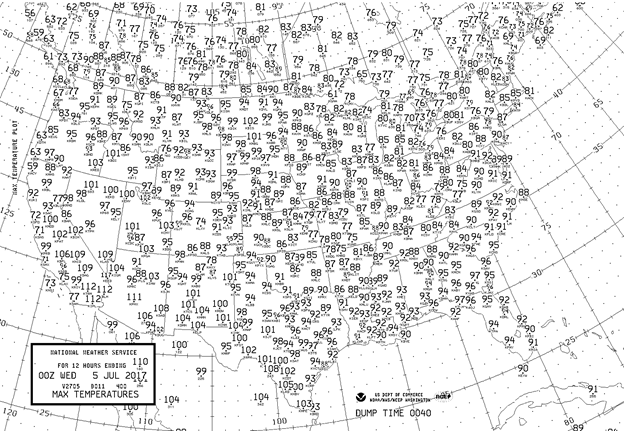
Evening update: Here are Wednesdays maxes:

Notice that today’s maxes were higher than guidance in some instances. The Dakotas baked above 100F. Salt Lake City reached 105F, which broke the old record of 104F set in 1973 looking at the stats from this post on July 4th.
We will be keeping tabs on Salt Lake City for as long as this third heat waves lasts.
The Climate Guy
___________________________________
Tuesday July 4th… Dear diary. Happy 4th of July! I sincerely hope that the United States will be around for centuries to come after its 241st birthday. The very survival of our nation will be under stress from climate change later this century, unfortunately, due to sea level rise and heat wave related drought. I’ll delve into that bad news on future posts. The task at hand today is to relate how bad the nation’s third heat wave of this summer season will get.
As stated yesterday the “unofficial” start to this third heat wave, which will initially reside in the West, will be on July 5th. In truth, the second heat wave, or southwestern heat wave of June, never really relinquished its hold on Arizona and Vegas where maxes have remained well above 105F. Yikes! By tomorrow near record setting heat will be occurring in association with that well advertised rebuilding ridge from the Rockies to the West Coast and into South Dakota:
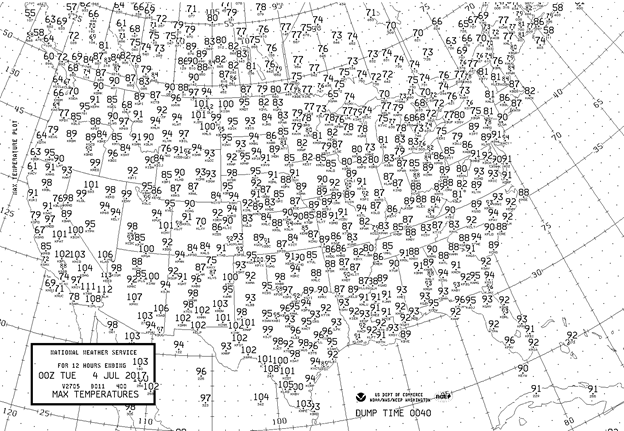
Here are today’s maxes:
O.k. Ok. After looking at this chart, since it was as hot as a firecracker in the West, I’ll just go ahead and designate the 4th as the start of the third heat wave.😉
Since the heart of the ridge will be near Utah for days, lets concentrate on how many days at or above 100 that city will reach. On July 4th SLC reached 102. On the 3rd the max at SLC was 99. To get the temperature forecast for the next week from the GFS model the following NWS site can be used: http://www.nws.noaa.gov/mdl/synop/mrfmosmap.php
Here is the data for SLC from this morning:

Here we see that the GFS forecasts maxes at Salt Lake City are at or above 100 through at least next Monday.
We can use the following site to compare the forecast maxes with record maxes for July 5-11:
For Salt Lake City:

Since the GFS guidance skews towards climatology, at times, we may see a record high regime at Salt Lake City for at least the next week in association with this heat wave… and that’s just one location to be affected.
More bad news. Model ensembles are forecasting the ridge with its heat to expand with its heat into the Plains by mid-July:

On a brighter note, I’ll leave everyone with this great, patriotic poster tonight.😊

The Climate Guy
_______________________________________________________________________________
Monday July 3rd… Dear diary. For the rest of this summer I will post the national map of forecast maxes for the following day, then after 9:30 PM EDT the actual maxes for today’s date. We’ll see how much dangerous heat builds, at a glance, as the summer progresses.
Tomorrow will be the 4th of July holiday. Most areas outside of the West will see near average temperatures, but those outside will need to take some precautions due to typical heat and humidity… just ask those Peachtree Road Race runners in Atlanta. The 3rd heat wave of the season will be building in the West, but its unclear if the heat will be as high or intense as that of June.
Here are the actual highs for July 3rd:
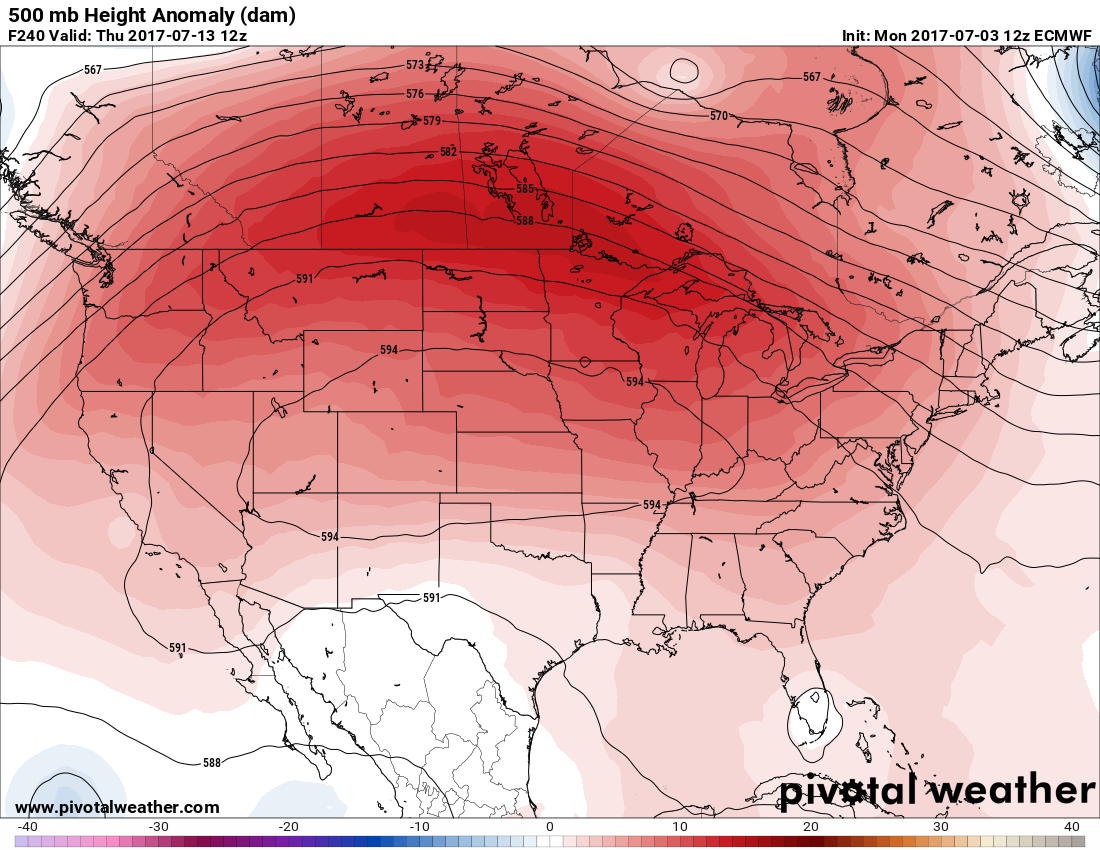
The most anomalous heat that catches my eye is that in Montana where several stations reached the century mark. Yesterday’s model runs indicated that Idaho, Montana and the Dakotas might take the brunt of the coming third heat wave with anomalous high heat continuing and intensifying. At least the operational GFS “fantasy” middles out beyond 240 hours have backed off substantial, high heat getting too far east of the Rockies. However the operational European model does not:
What about the GFS operational model valid for the 7th…the day we have been consistently looking at? Here we see that a 597+ decameter ridge is still forecast, but the position is much further south (now forecast over the Four Corners area) than what I presented on the 1st:
Of course, we’ll get a better idea where the worst of the heat will be tomorrow and by what I’ll roughly delineate as the first day of the third heat wave on the 5th when the western ridge significantly balloons.
The Climate Guy
_____________________________________________________________________________________
Sunday July 2nd… Dear diary. Ensembles and models continue to paint a bleak picture for the West after the 4th. A prolonged, record setting heat wave from the western Plains westward through the Rockies to the Pacific coastal states is now a slam dunk. The only question now is how far east will any significant heat get. It looks like the heart of the ridge will stay over the Rockies, but some guidance suggests that from time to time, bursts of heat will ride east then southward around the thing.
When I was working at The Weather Channel my co-workers and I called any operational model valid after about 240 hours out “fantasy models” because details usually never verified, although some were fun to look at. Here is a “near worst cast heat scenario” fantasy GFS model from this morning valid for Friday the 13th of this month. The Plains and South will have some bad luck if this thing verifies😉:
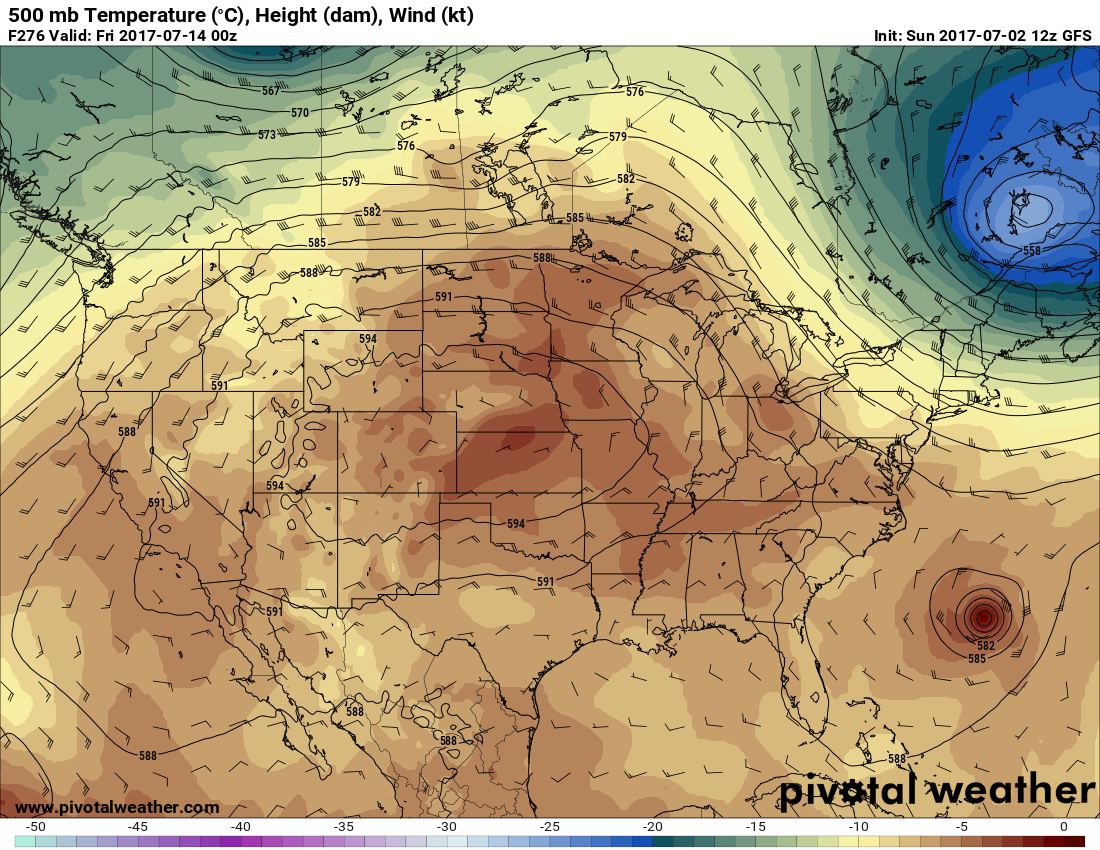
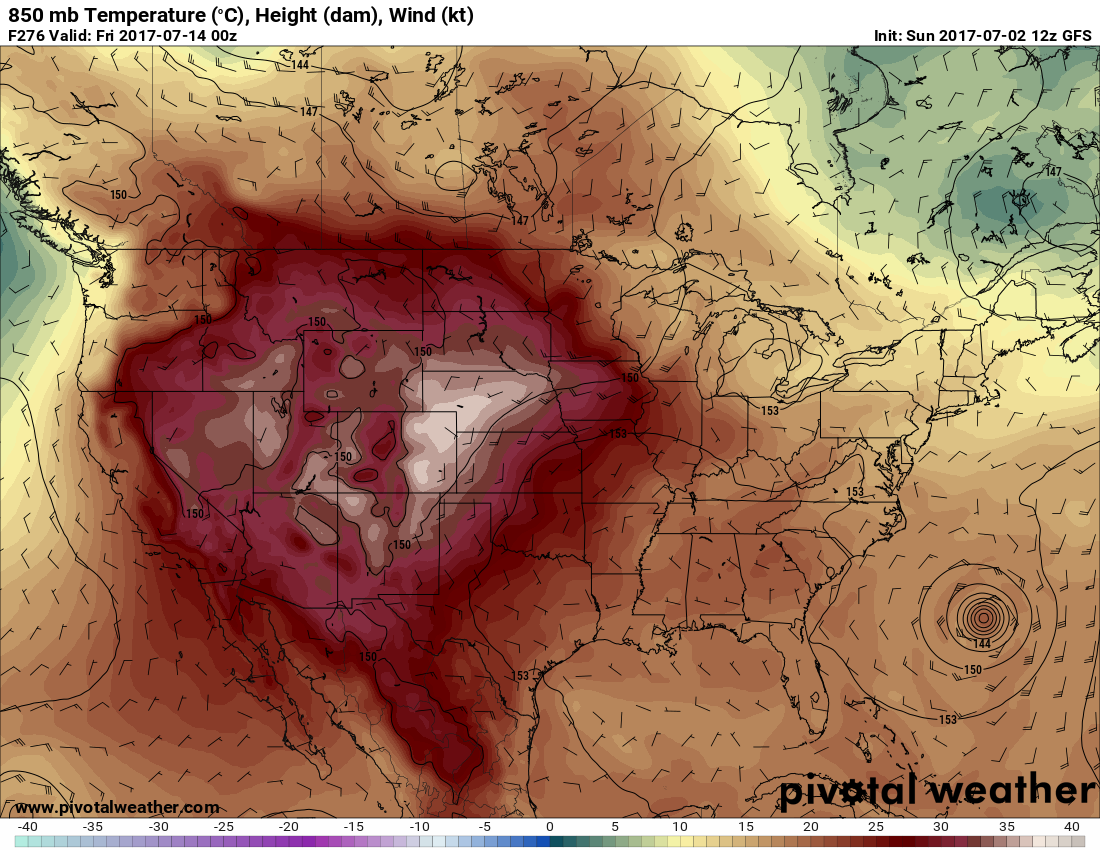
In this case the ridge extends eastward to the Mid-Mississippi Valley. This operational model run even has an organized tropical system moving north off the Southeast Coast. In my experience, if a hurricane is close to the Southeast Coast during the summer, but does not come inland, the weather in the Southeast gets frightfully hot due to subsidence west of the system. The “fantasy” 850 Mb temps are nearly off the chart in the west-central Plains:
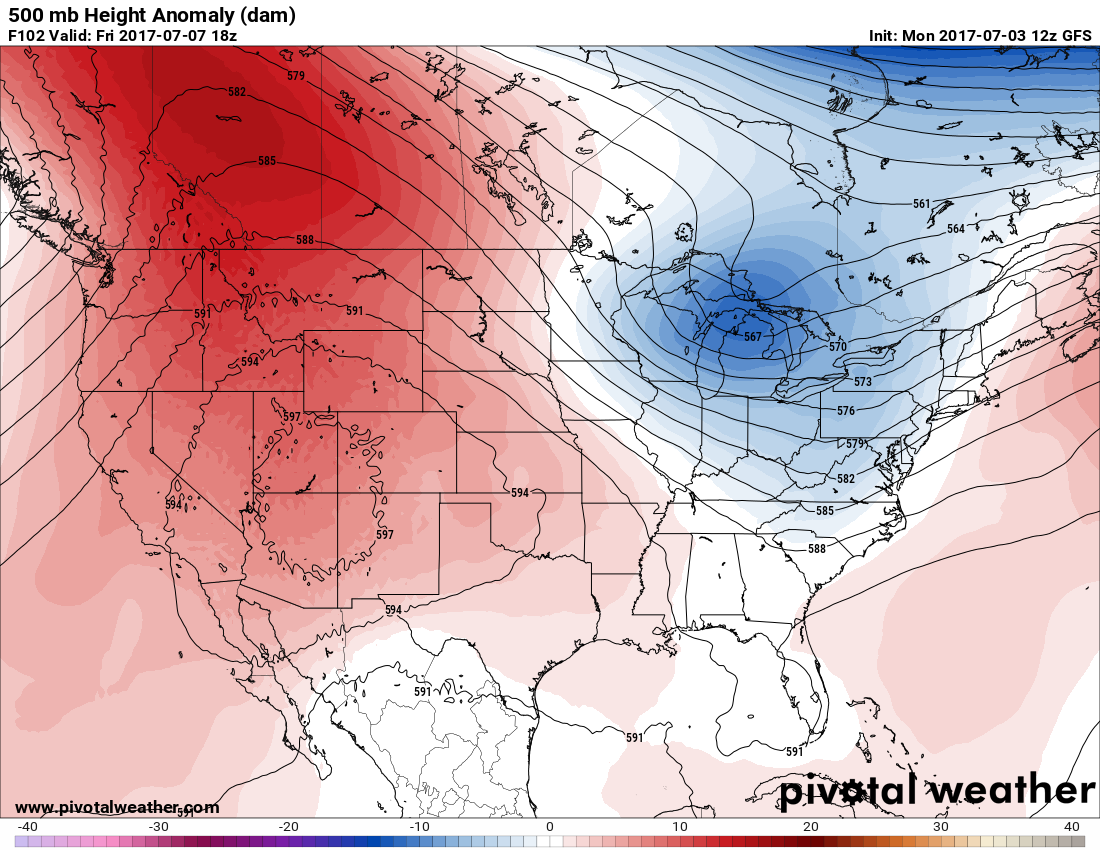
I saw a model scenario yesterday that would put a big kibosh on any heat east of the Rockies shown here:
In this case a system moves east over the top of the ridge then digs south and west into what typically would be what is called the mean long wave trough residing well east of the Rockies ridge. Meteorology models rely on wave dynamics to forecast where ridges will set up and troughs, or paths for weather systems to move, develop. In physics and meteorological thermodynamics if the wavelength between ridges is too long, then a trough will develop in between. Here we see a trough developing between the Rockies ridge and the Bermuda High ridge, which is entirely plausible. On a side note, the tropical system does move inland along the Southeast Coast on yesterday’s GFS model run.
By the middle of the month which fantasy scenario will develop? Could the chart that verifies be somewhere in between? Stay tuned to find out.
On Monday heat will already be building in the West in response to our developing ridge, and it will be typically toasty for early July elsewhere:

The Climate Guy
_________________________________________________________________
Saturday July 1st… Dear diary. Welcome to July, which is typically and climatologically the hottest month in the calendar year for most locations across the United States. Climate change is beginning to make this a brutally torrid month, though. Instead of a reasonably hot month to look forward to for kids enjoying themselves outside or for those playing tennis, for example, July will be dreaded for excessive heat as we roll along through the 21st century.
So what’s in store, heat wise, early this month. That advertised third heat wave I’ve been harping on looks right on track after the 4th. To be consistent with my last couple of log entries let’s concentrate on the model data for the 7th. To have confidence in ANY forecast more than about five days out, people in the meteorological field look for ensemble and model consistency.
Let’s do a brief lesson about looking at the “deterministic” or “operational” models, and “ensemble members” to determine their viability for a forecast… in this case that heat wave. I am continuing to use the Penn State GFS ensemble graphics for said day… the 7th. The operational model, or model run on most sites like Pivotal Weather, is marked in white (500 Mb height contours at 576 and 594 outlined or shown in circles). Most strong ridges in association with heat waves have 594+ dm heights, thus forecasters key in on that line on charts (why it is marked in most graphics).
The operational model is in sync with the myriad of other ensemble member squiggly lines on the diagram, so we know we can rely on it in this case. The most anomalous heat, as denoted by the orange colors, will be from the central Rockies northward into western Canada on the 7th.
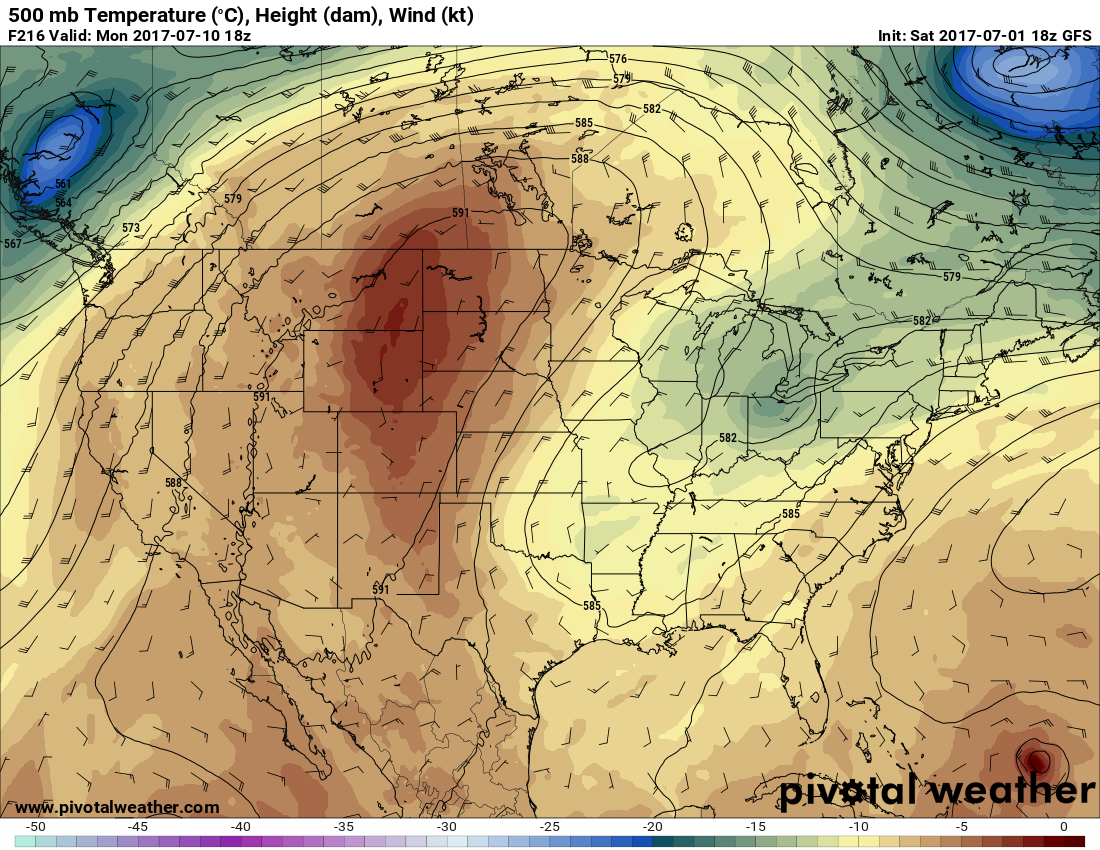
Now, let’s look at an example of an operational model outside the bounds of the rest of ensemble members. Remember, it behooves meteorologists to follow the “best average” of ensembles to make a good forecast. Rarely, an operational model well outside the bounds of ensemble averages will verify, but the key word here is RARE. This one is valid much further out in time on 00 Zulu the 11th. Notice that the ensembles have a 594+ dm ride over the Rockies and High Plains (in brown), while the operational model (in white) does not and shifts the jet southward over the Great Lakes much further south.
Looking at the chart we can concur that our heat wave ridge will be stronger Monday evening the 10th, and their probably won’t be as much cooling in the Upper Midwest as indicated in the operational model. O.K. Our met lesson is over for today.😊
Already on the 1st we are beginning to see a warming trend across the southern tier of states and Plains, although a heat wave is not occurring, per se. Here are the forecast maxes by the GFS for today and on Sunday the 2nd:
Sticking with the 7th, I am very confident now that the third heat wave of the summer will be underway by that time in the West and High Plains looking at the operational models. Here is the GFS:
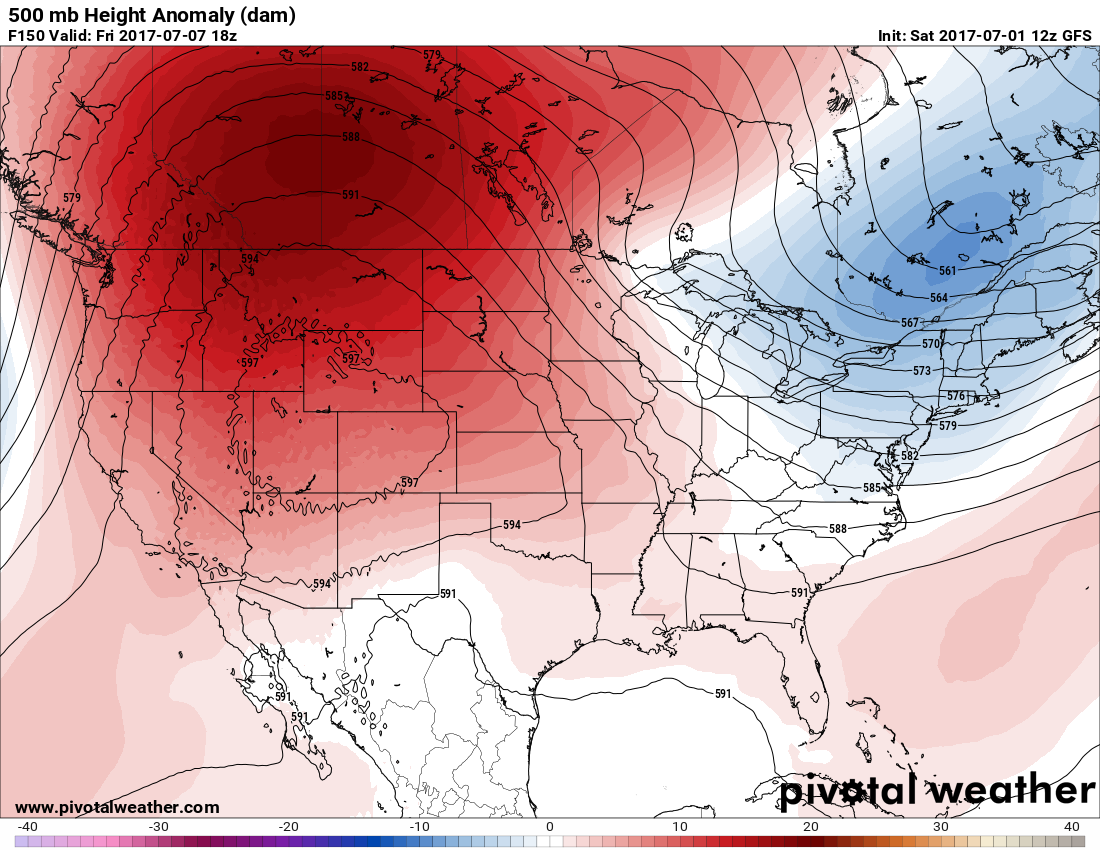
Most models have the dreaded 597+ dm height contour centered over the Rockies. Look for exceptional, record breaking heat with a ridge this strong. Looking at the long wave pattern I suspect that a trough in the East will protect the Northeast from any extensive or prolonged heat wave through much of this month. Any record lows will probably get set from New York into New England through the 15th, although the atmosphere may be too warm from coast to coast to chalk up many cold tallies.
One update this evening: Wow! Since 500 Mb heights are already rising in the Southwest maxes at Phoenix and Vegas have gotten above 110 again.
To see all 2017 Heat Diary entries click:
https://guyonclimate.com/category/heatdiary2017/
The Climate Guy