Those that have visited this site know that I am big into meaningful stats. One in association with record high temperatures, and thus climate change, is the current record streak of consecutive months of more daily high records than daily low records reported in the NCEI database. That alarming streak has reached 28 months as of March 2017 dating back to December 2014. It looks like the streak may very well reach 29 since April has gotten off to a warm start and model ensembles are forecasting a warm pattern beyond tax day. I have been tweeting on the streak since the middle of 2016.
So, have we reached a milestone or statistical tipping point, in which all months in the future through the 21st century will have more daily record highs than daily record lows across the U.S.? My best educated guess answer is probably not, depending upon ENSO and strong, negative North Atlantic Oscillations, although if we see one more strong El Nino combined with global warming from carbon pollution, yipes! Katie bar the door. One of my first posts did link the streak to the last strong El Nino here:
https://guyonclimate.com/2017/01/20/el-ninos-ramping-up-the-heat/
For this post let’s put two and two together and see what type of a warming trend we have. From the National Center for Environmental Information site here, let’s combine the longest streaks of more DHMX’s than DLMN’s from my “records genome” with U.S. temperature averages: https://www.ncdc.noaa.gov/temp-and-precip/climatological-rankings/index.php?periods%5B%5D=1&periods%5B%5D=12¶meter=tavg&state=110&div=0&month=3&year=2017
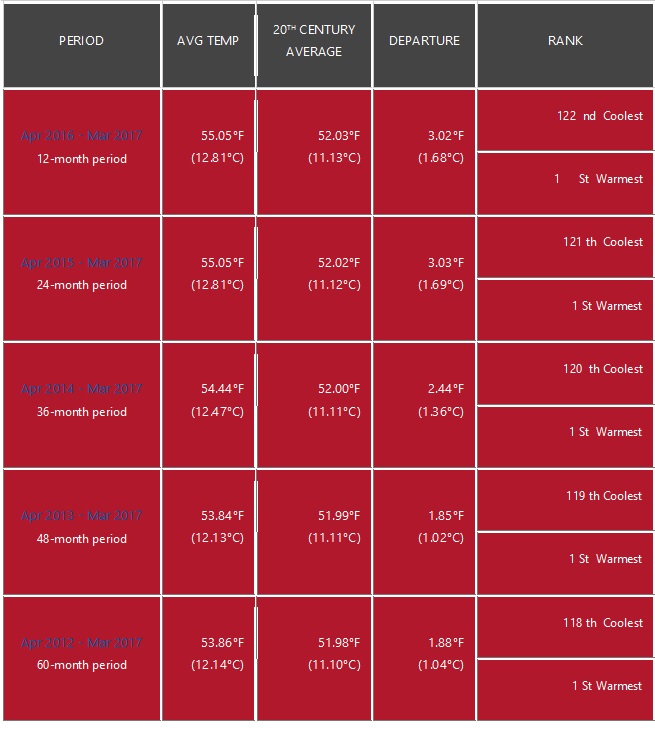
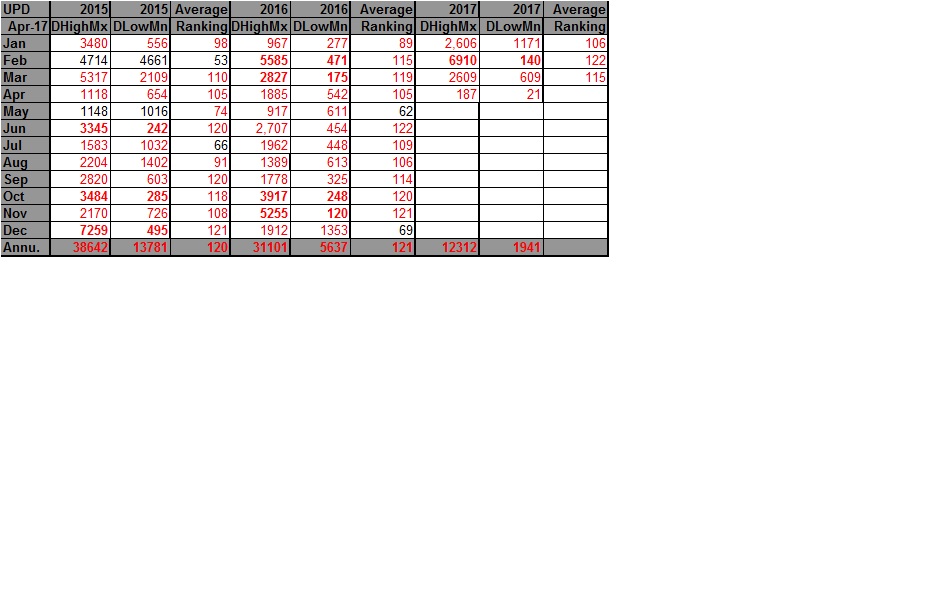
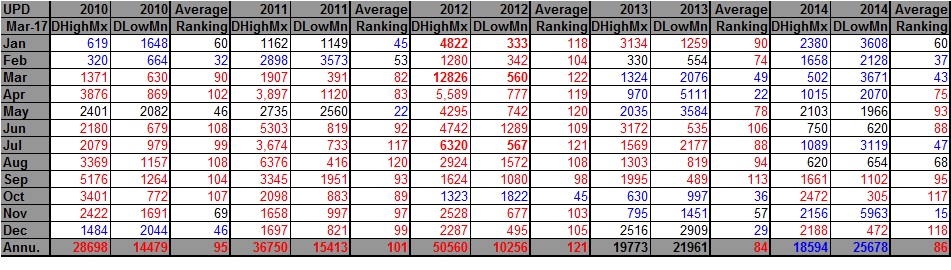
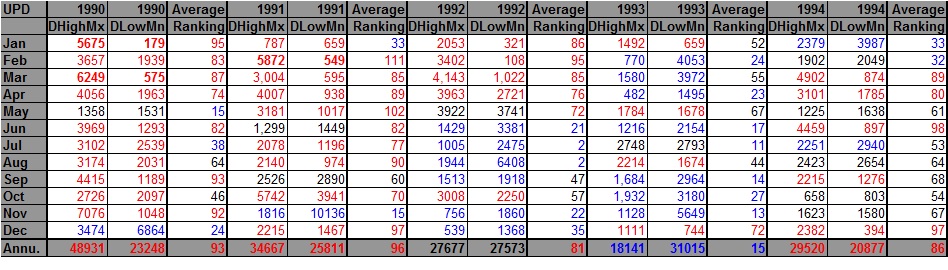
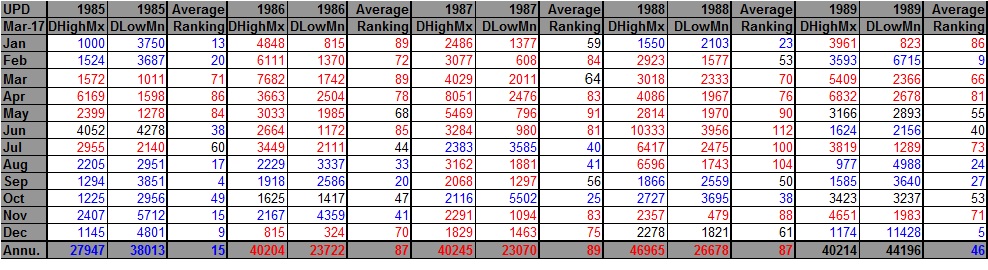
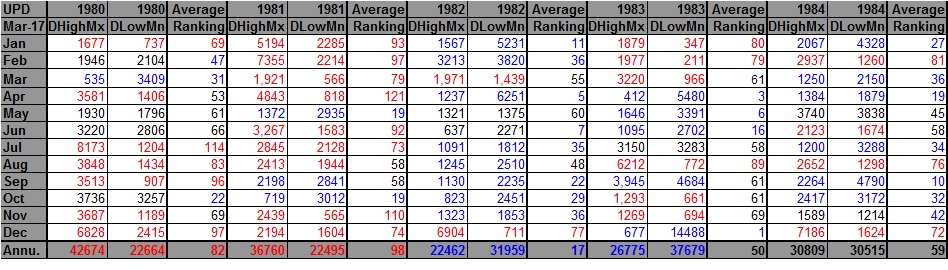
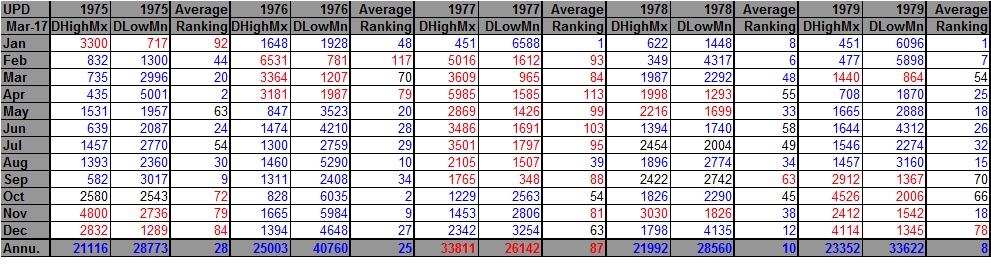
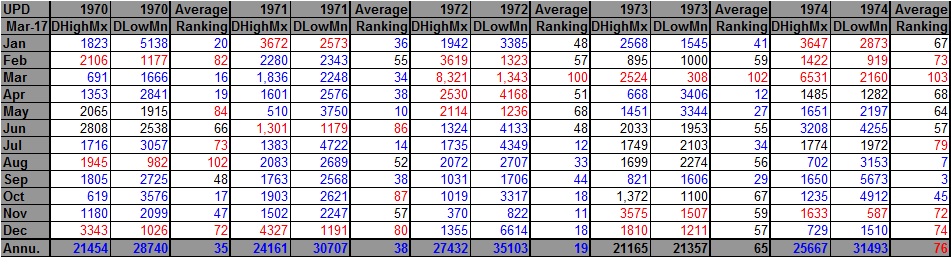
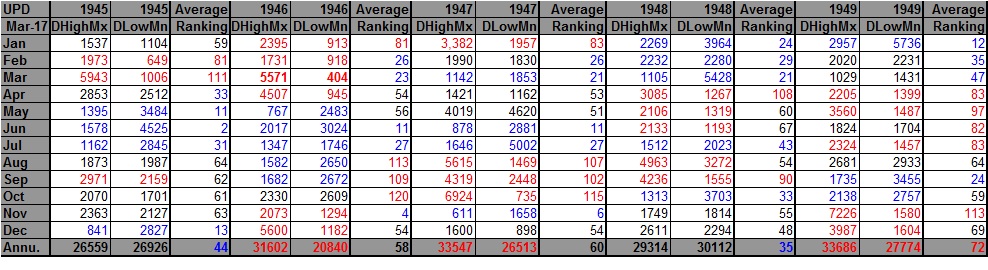
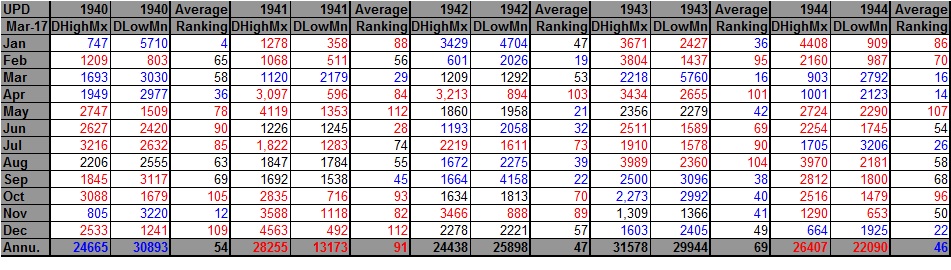
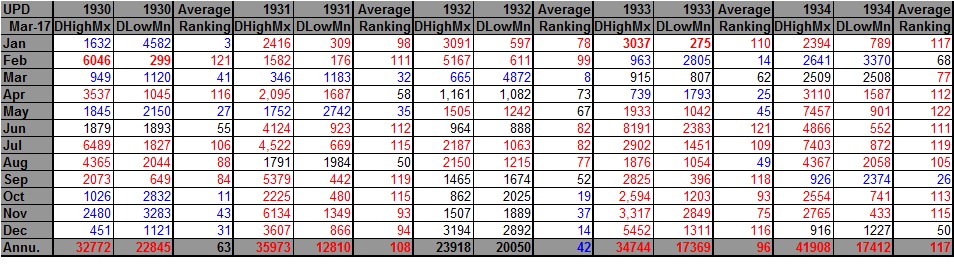
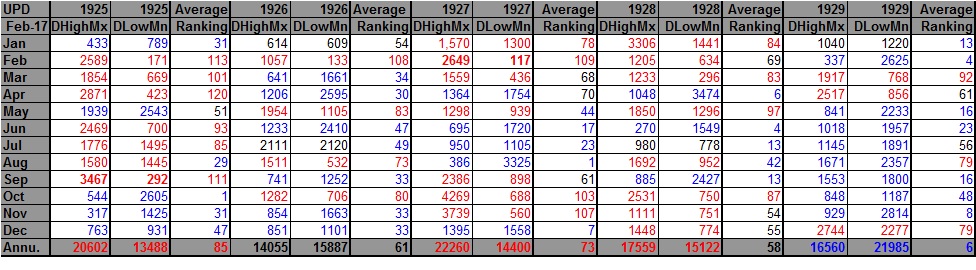
I was not surprised to find that the last one, two, and three year period, the timespan which is part of the current 28 month streak, had the warmest temperature averages across the lower 48 states since 1895. Averaging in the 28 month streak also gives us the warmest four and five year period in the NCEI database through March 2017. The proof is in this dark, red chart below. I’ll emphasize again, that this fact is more data confirming an alarming warming trend! My records genome with the latest record counts, where I am getting streak counts of months, is displayed at the end of this post.
What happens to the NCEI average rankings when we start them back from the time before the 28 month streak in November 2014? The results are startling:
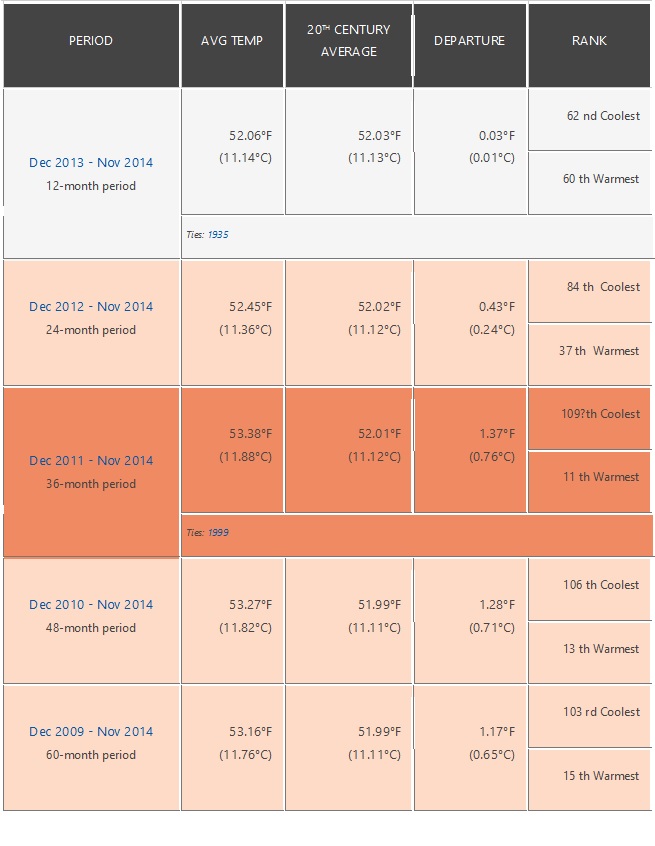
Yes, minus the current 28 month warm streak, the current decade would have averaged a lot colder, mainly due to two relatively cool years from 2013 to 2014.
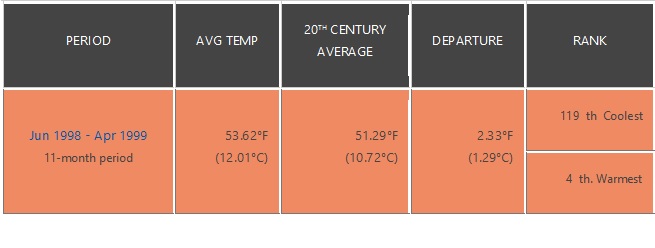
The second longest streak was 19 months from March 2011 to September 2012. Here we see that average temperature data from the two year period ending in SEP 2012 was 4th warmest. It’s interesting that the two longest streaks have occurred during this decade.
![]()
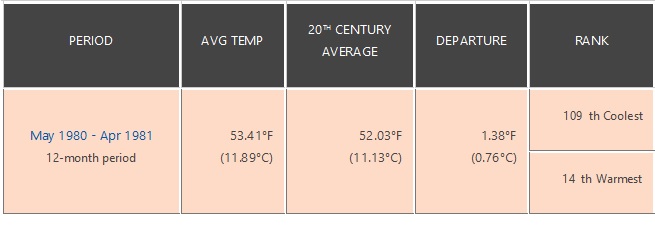

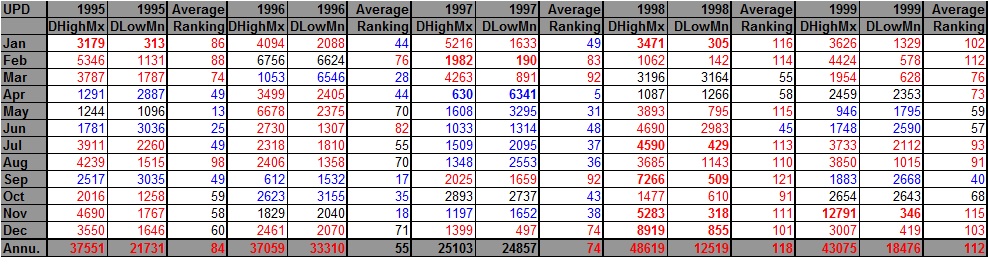
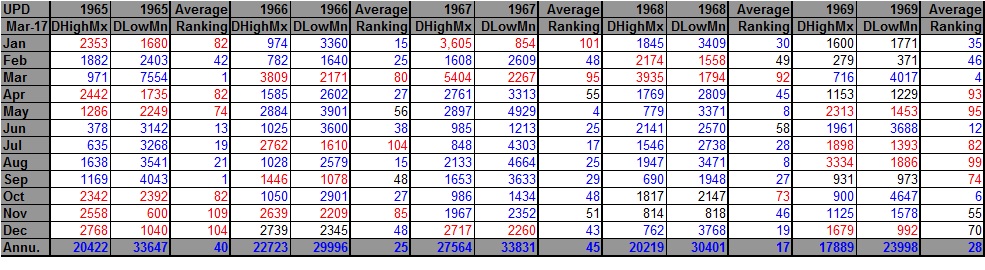
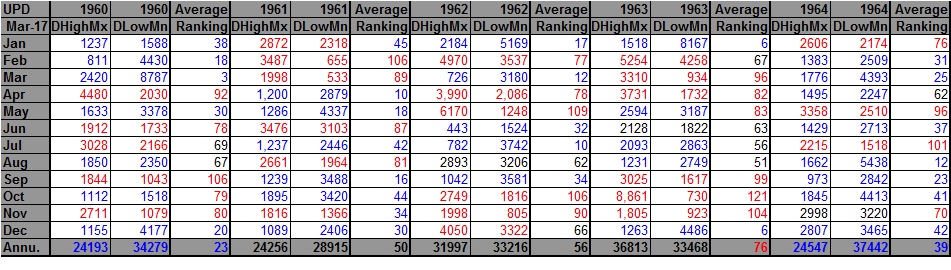
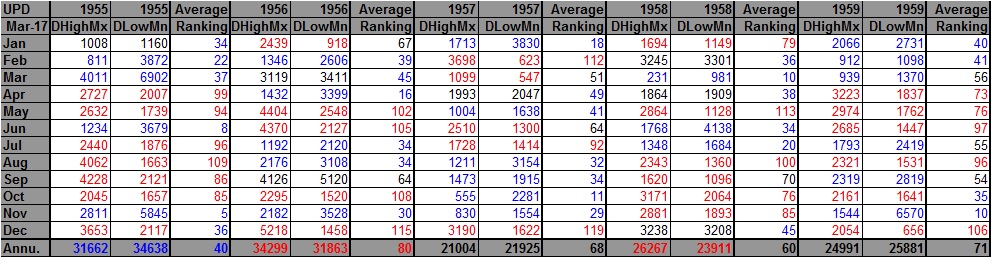
I’ll emphasize that none of these streaks come close to the current streak of 28 months of more DHMX’s than DLMN’s and associated temperature averages. Just to look at the cold side of streaks, the longest period for more months of DLMN’s than DHMX’s in my database was 13 months from April 1968 to April 1969. That period averaged 10th coolest. The 1960’s are the coldest decade in my records database.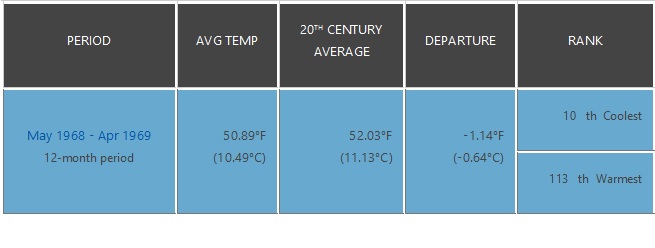
It will be interesting to see how long the current 28 month streak lasts. There are hints that a weak to moderate El Nino may occur later this year only bringing more fuel to the fire. Why is this important? As noted the higher the temperatures, the greater the chances for heat waves and flash droughts during summers. I will endeavor to track this data for as long as possible.
The Climate Guy
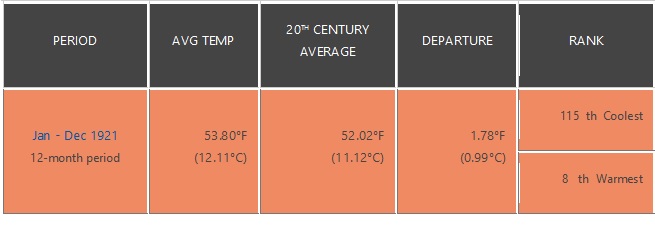
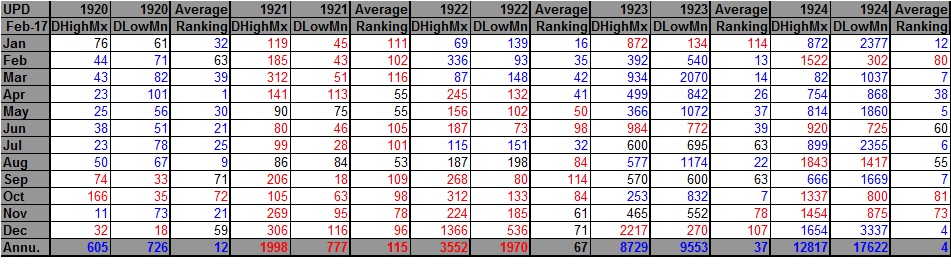
The rankings are for the lower 48 states with the warmest ranking since 1895 of average temperatures being 123 and 1 being the coldest. Blue colors represent cold months and red warm. Time stamps for when I last updated each dataset are located in the upper left hand corner of each chart.


2 thoughts on “Streaking Past a Tipping Point?”