So how have the ratios of all-time record counts been charting the last few decades? All-time records would be the crème de la crème of the hottest or coldest temperatures ever recorded at a site, and to weather historians the most interesting. Over the last few posts I have shown charts of daily and monthly counts of records all pointing to an increasing warming trend from 1980 onward. Surprise! This has not been the case with all-time records so far during the 2010’s (with the caveat that we have just under 3 years left to get more reports for the 2010’s):

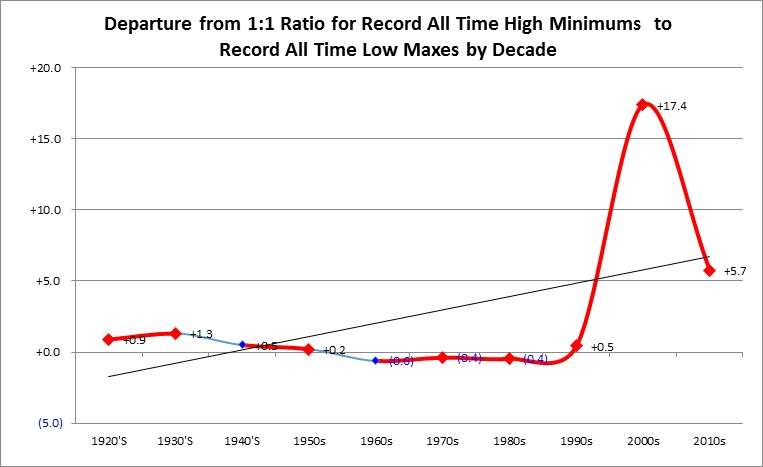

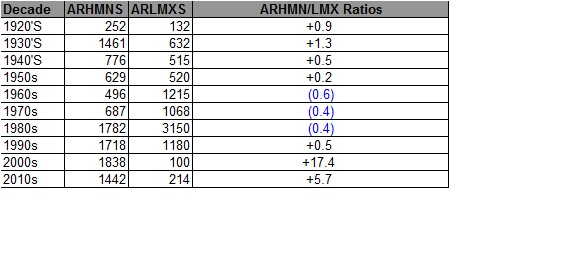
Notice how the decade of the 2000’s sticks out like a sore thumb. There was an extreme spike of the ratios of all-time hot records to all-time cold records during the first decade of the 21st century as opposed to the decades of the 20th century. The United States had relatively few extreme cold events during the 2000’s compared to the 2010’s. Why? There are two reasons.
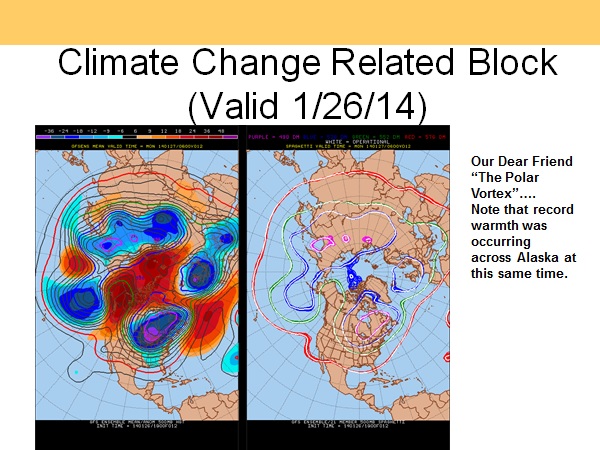
First, there was a synoptic phenomenon in the northern hemisphere that gave climatologists pause for a couple of years and those denying that anthropogenic climate change was occurring glee…. the dreaded polar vortex or extension of the polar vortex into the United States. Here is an example from January 2014. The atmosphere could still get cold enough to produce many all-time lows from 2013-2015. Large-scale warmth over and around the north pole had trapped a cold pocket centered near Hudson Bay ushering in repeated cold blasts into the lower 48 states from 2013-2015. The cold synoptic pattern began to relax in the spring of 2015 with the advent of a near record strong El Nino. As an aside, including March 2017, this will be the 28th consecutive month of more daily highs than daily lows starting in December 2014.
Interestingly in 2013 while most of the rest of the planet had warmer than average temperatures, the United States had cooler than average temperatures. Why globally, 2013 was warmer than 2012, when the U.S. had a wickedly hot year:
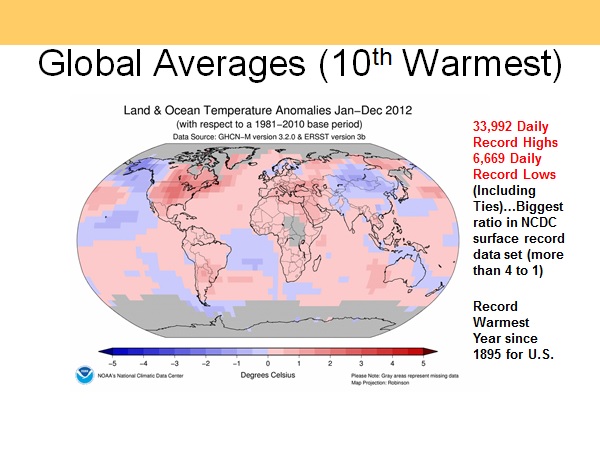
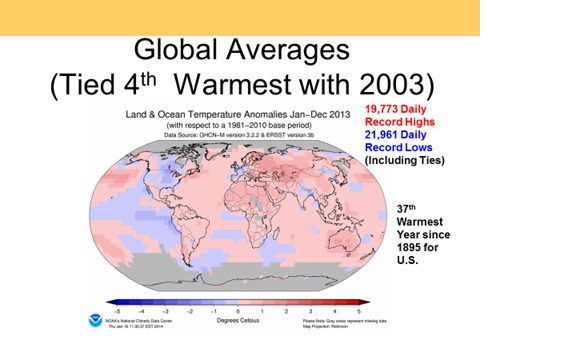
Yes, even in a warming world, an area the size of the lower 48 states can still see below average temperatures on a yearly basis.
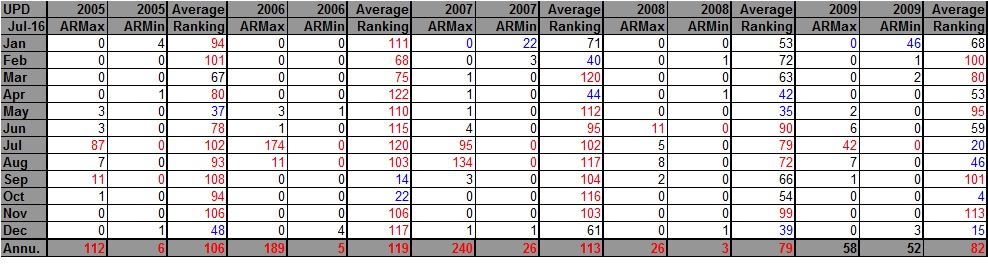
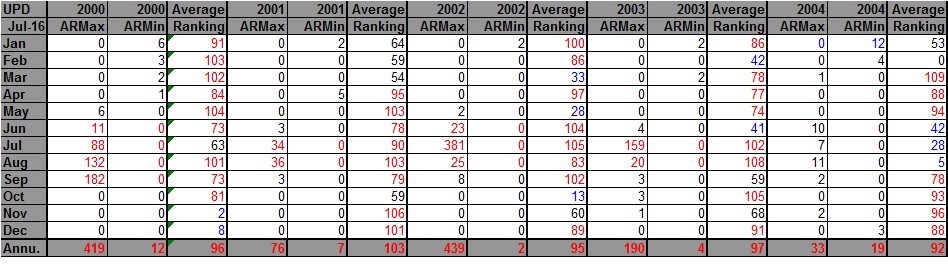
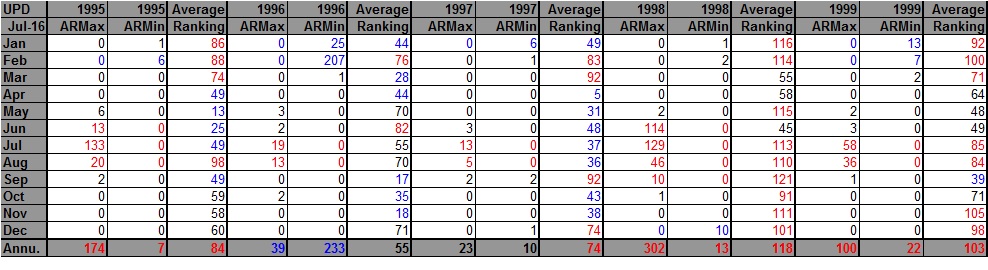
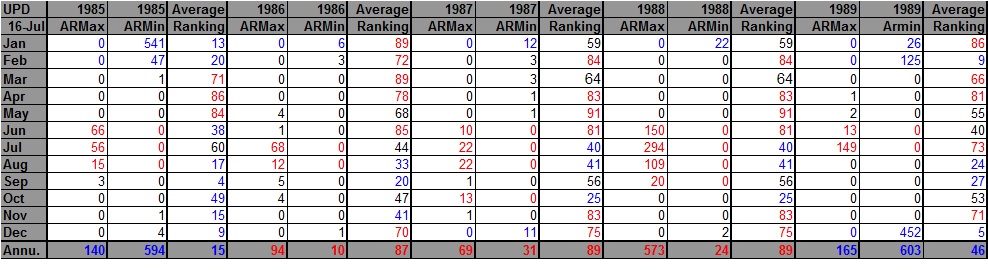
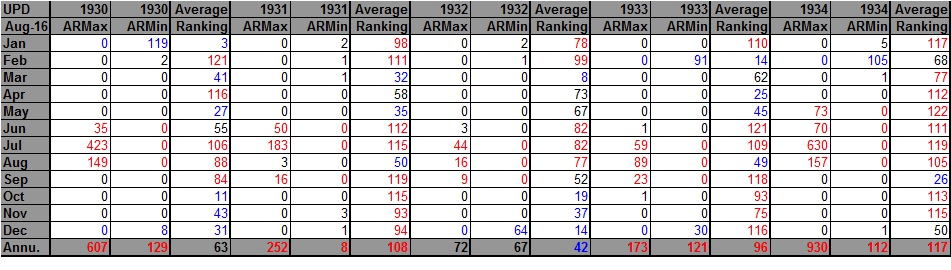
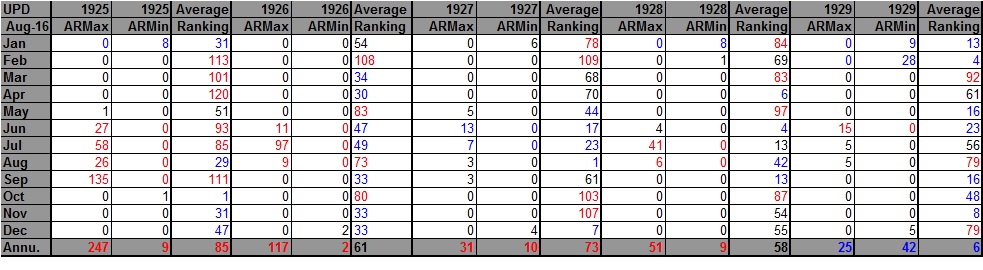
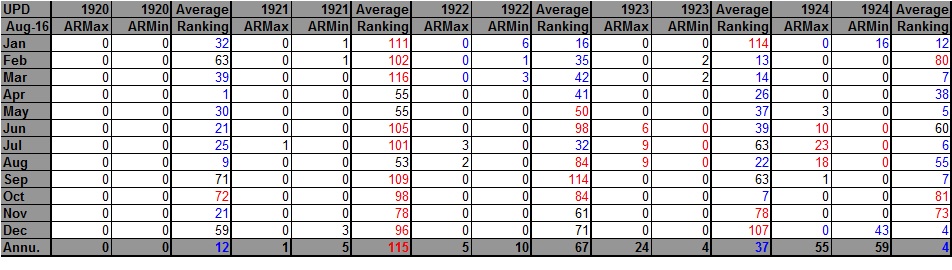
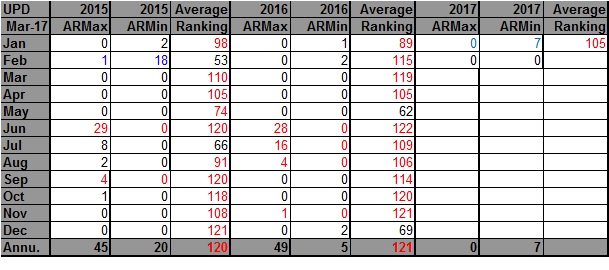
Here are my counts of all-time records set in the United Stares for this decade:
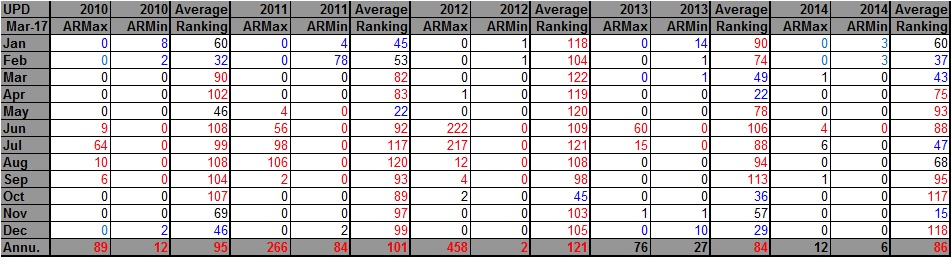
Of the 163 reports of all-time record lows in the NCEI database 53 occurred from 2013-2015.
Notice that 78 alone happened in February 2011. What was happening then? The second reason why the number of all-time mins are higher this decade than during the 2000’s was a synoptic pattern producing some all-time cold conditions in the Southwest during February 2011. Quoting NCEI: “Some cities in the Southwest recorded their lowest all time February temperatures early in the month. The extreme cold that settled in the Southwest during the first few days of the month set numerous records and caused widespread damage. It was estimated that in El Paso, TX, over 15,000 pipes broke with damage at over $50 million. Albuquerque recorded their lowest February maximum temperature (and second lowest ever) with 9 F (-12.8 C) on the 2nd. In addition, the minimum of -7 F (-21.7 C) was the second coldest February temperature on record. In Douglas, AZ, a minimum of 0 F (-17.8 C) on the 4th set an all time February mark and was only the third time in history the city has reached 0 F (-17.8 C). The lows at Tucson, AZ of 18 F (-7.8 C) on the 3rd and 4th were not only their coldest February temperature on record but only 2 degrees F (1.1 C) away from their all time low. Roswell, NM, hit -11 F (-23.9 C) on the 4th, which was the coldest February temperature since 1933 and coldest for any month since 1966. Laramie, WY, hit a new February low of -39 F (-39.4 C) on the 2nd as well, in a record dating back to 1948. Roughly 32,000 residents in New Mexico and 14,000 in Arizona had no natural gas on the 4th due to shortages brought on by the extreme cold.”
I remember that the arctic surge dropping into the West during February 2011 was sharp, but not cold enough to produce all-time cold monthly averages by state. Those 73 reports may not have been as significant as those from past decades.
The following NCEI chart ranks how cold it was in the U.S. back in February 2011:

That leads me to the last item of this post. What if there was a method for comparing record temperatures from different eras to judge how statistically significant each were? Remember that all of my posts and surface record studies, so far, compare ratios of tallies of counts. One tally could be from a tied record or by one set by several degrees. There needs to be a method for statistically comparing the significance of each count. Perhaps Bob Henson’s and my Extreme Temperature Index could do just that.
Look at my guest post on Category Six for details on The Extreme Temperature Index: https://www.wunderground.com/blog/JeffMasters/comment.html?entrynum=3583
The algorithm is posted here:
![]()
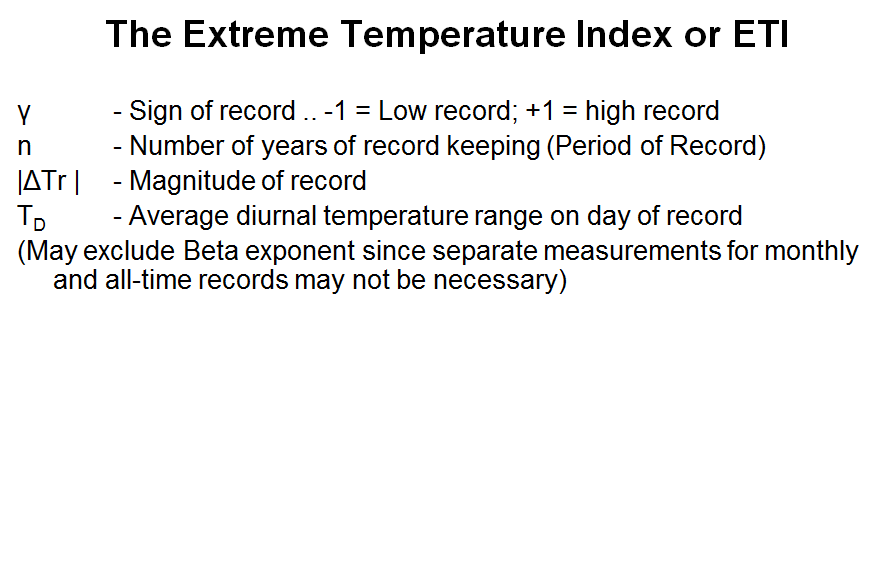
Please reach out to either myself or Bob Henson if you are seriously interested in doing a dissertation or developing the Extreme Temperature Index.
Why is this important? By knowing recent patterns of how the most extreme hot conditions have occurred, we can better prepare for upcoming heat waves.
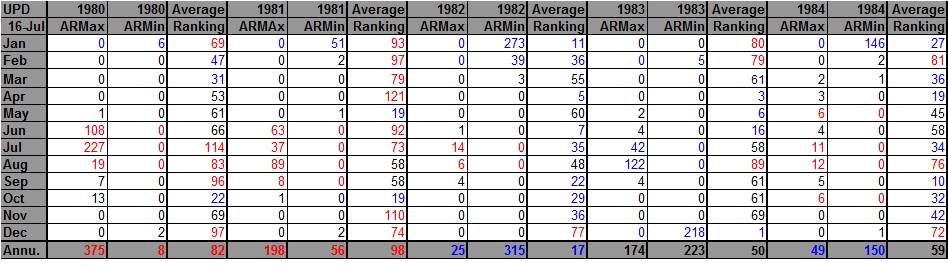
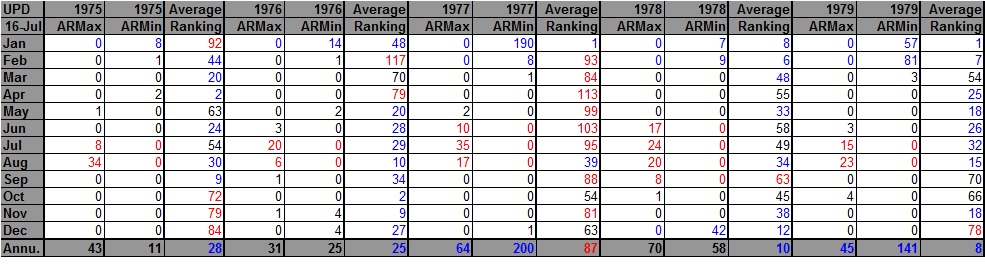
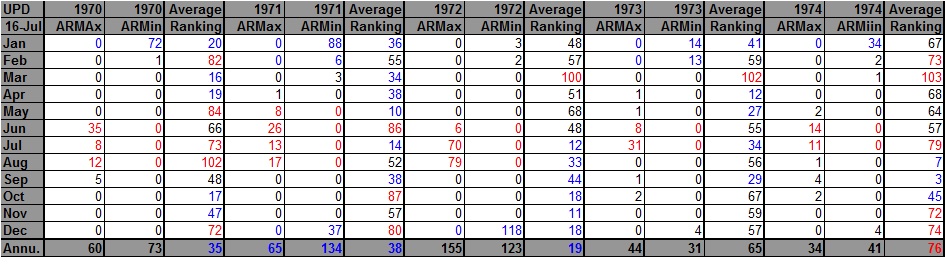
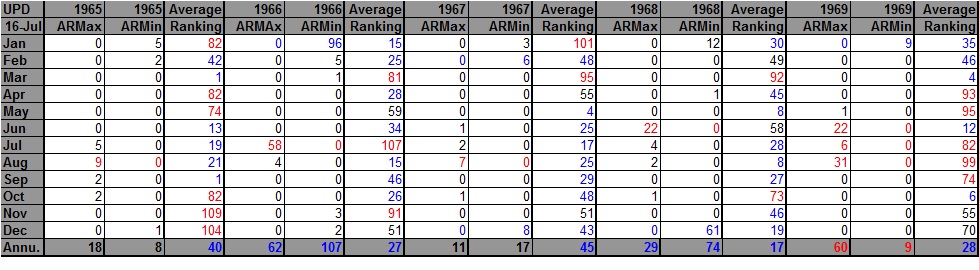
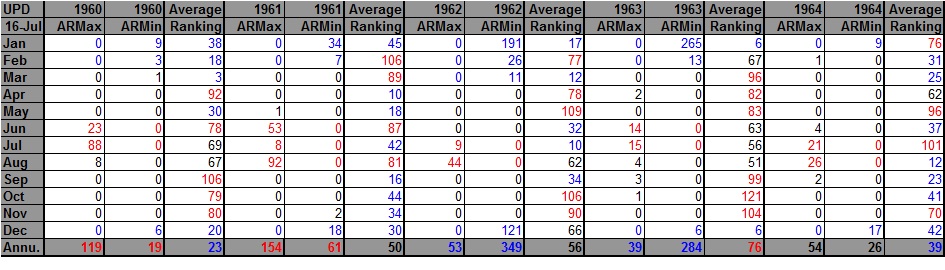
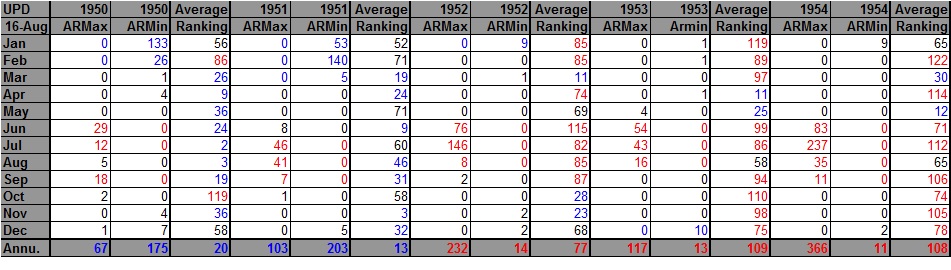
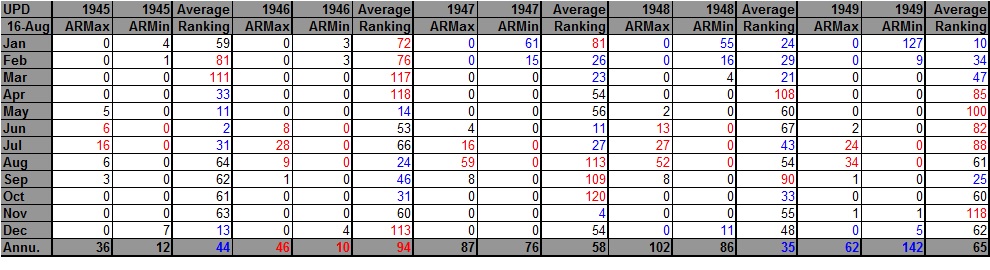
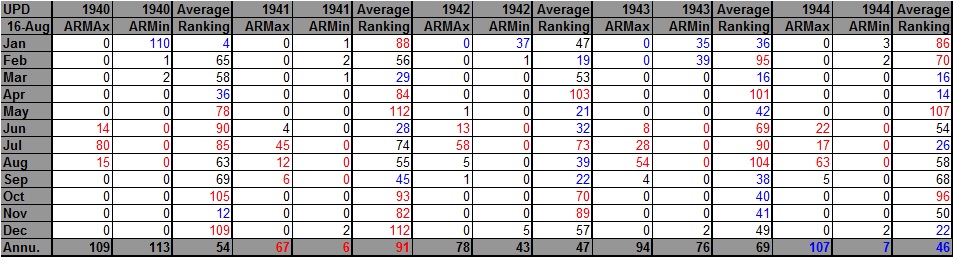
Just like with daily and monthly record counts by year in prior posts, I have archived all-time record high maxes and low mins at the end of this piece.
The Climate Guy
The rankings are for the lower 48 states with the warmest ranking since 1895 being 122 and 1 being the coldest. Blue colors represent cold months and red warm. Months that had near 1 to 1 ratios are colored black representing neutral months. Time stamps for when I updated each dataset are located in the upper left hand corner of each chart.