The main purpose of this ongoing blog will be to track United States extreme or record temperatures related to climate change. Any reports I see of ETs will be listed below the main topic of the day. I’ll refer to extreme or record temperatures as ETs (not extraterrestrials).😉
Main Topic: Early January Record Scoreboard Update And Climatological Review
It’s time once again for our monthly climatological review. Here on this site we present monthly summaries near the 7th of each month, and each is available if you want to go back through my Extreme Temperature Diary archive. Every January the National Center for Environmental Information completes an assessment for the prior year, which I’ve included today. This particular month I’ve added a new category on my site for these posts here where you can check out reviews and statistics from prior months:
https://guyonclimate.com/category/record-scoreboard-climatological-reviews/
I’m repeating my mantra from last month:
December 2020 got ranked by the National Center for Environmental Information as a well average December, temperature wise, for the lower 48 states, coming in as the 106th coolest or 21st warmest since records began being kept in 1895:
https://www.ncdc.noaa.gov/cag/national/rankings
Record warmth occurred mostly across the northern tier of lower 48 states. There were a below average number of cold record reports:
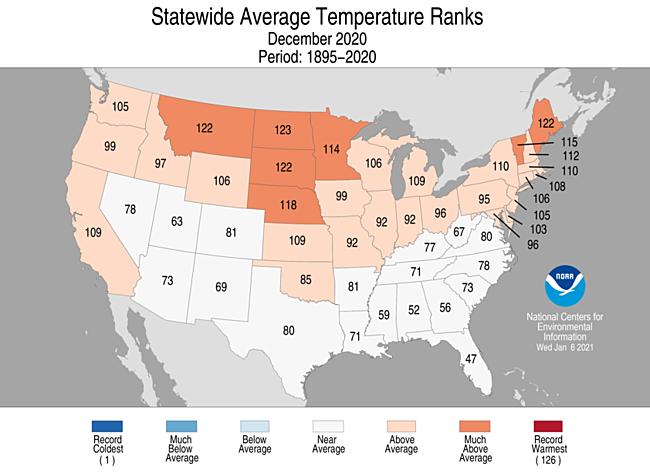
Not one state had a below average ranking in December.
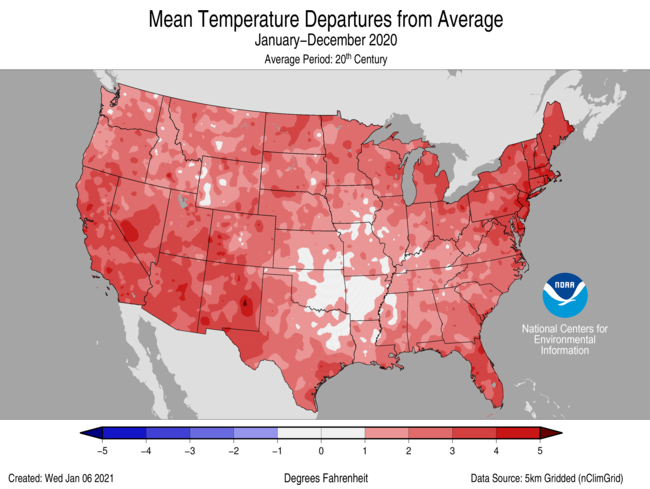
The lower 48 states was very warm during 2020, which had its fifth warmest or 122nd coolest year on record:
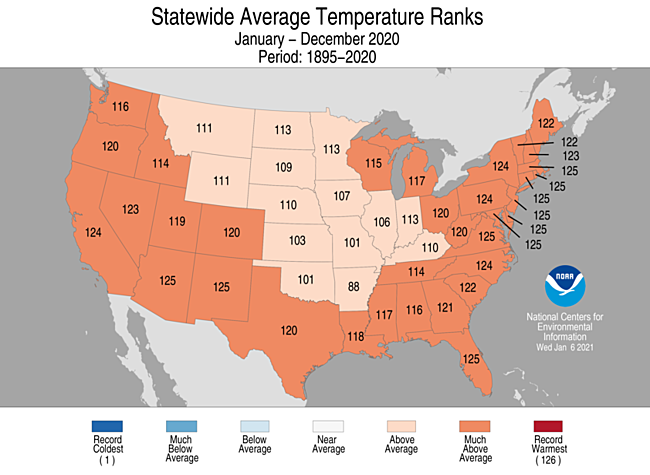
Alarmingly, not one state had near or below average temperatures. Everywhere except the Midwest had much above average conditions.
Here are my two U.S. Daily Record Scoreboards updated through 12/29/2020 (data compiled from the following NCEI site):
https://www.ncdc.noaa.gov/cdo-web/datatools/records
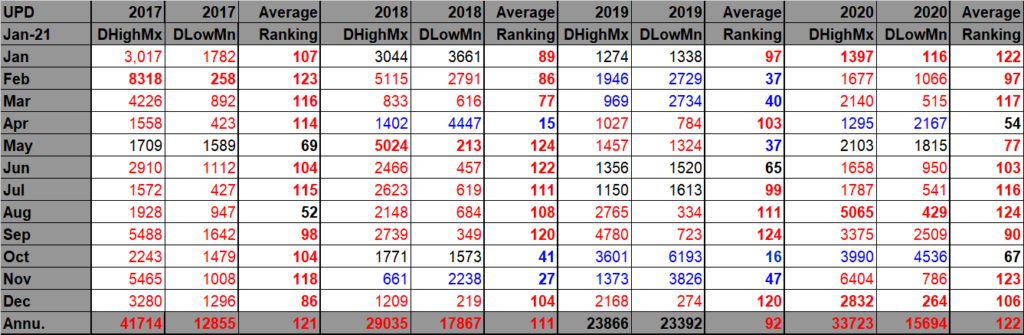
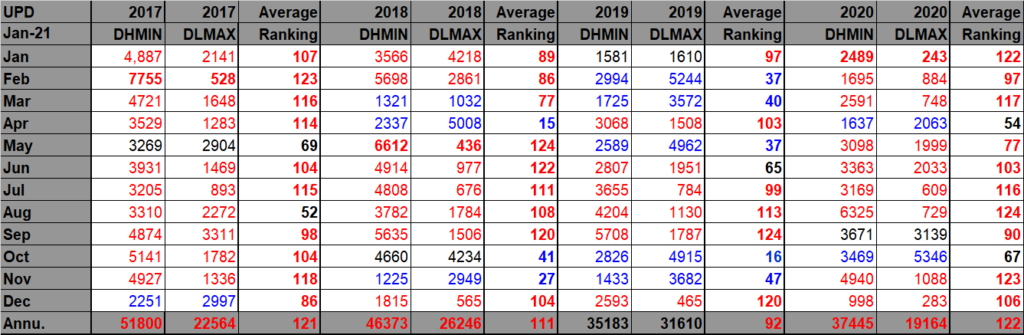
DHMX= Daily High Max Reports. DLMN= Daily Low Min Reports. DHMN= Daily High Min Reports. DLMX=Daily Low Max Reports.
For these data sets all monthly ratios of > 10 to 1 DHMX to DLMN or > 10 to 1 DLMN to DHMX are in bold type. The rankings are for the lower 48 states with the warmest ranking since 1895 of average temperatures being 125 and 1 being the coldest as of 2020. Blue colors represent cold months and red warm. Those months and years with counts close to a 1 to 1 ratio of highs to lows are colored black. Boldly colored months, such as January 2020, have ratios of more than 10 to 1 daily record highs to lows or lows to highs, and are either historically hot or cold, most of which have made news.
December 2020 had approximately an 10-1 ratio of record DHMX to DLMN individual record counts, so the color I used for this month was bold red on the top chart.
December 2020 had approximately a 10-3 ratio of record DHMN to DLMX individual record counts, so the color I used for this month was red on the bottom chart.
Due to climate change we are seeing less blue colors on these Record Scoreboards with time, and December 2020 was typical for thus trend.
As stated, the ranking for December 2020 was 106, which was colored bred. I color rankings +10 or -10 from the average ranking of 63 black, indicating that these are near average temperature wise. Record statistics matched up well with the ranking of 106 in December.
We are seeing indications that in January 2021 we will have near average temperatures for most U.S. states looking at meteorological guidance except in the dry, parched Southwest where above average warmth will continue.
As far as the year 2020 goes, as stated the ranking for that year was 122 signifying that this year was the 5th warmest on record. We can compare record numbers with the six warmest years on the following graphic:
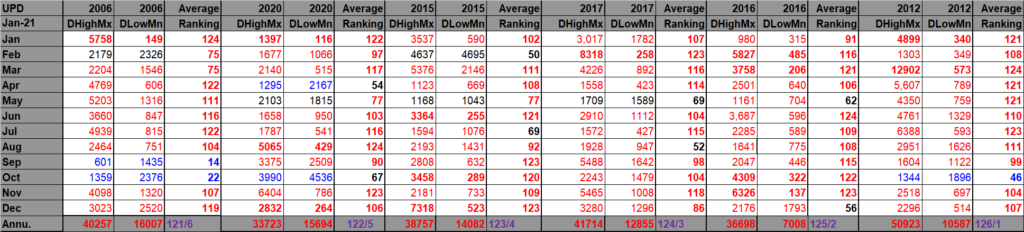
For these six hottest years only 5 out of 60 months had significantly more daily record mins than maxes (colored in blue). Two of these occurred during 2020. Each of these years had some sort of historic, dramatic event in association with climate change. For example, the heat wave of 2012 was terrible. Maxes reached an amazing 106°F in my hometown of Atlanta, which is an all-time record to this day. I fear that we are on the cusp of seeing a lot of such years moving into the 2020s.
Here is much more detailed U.S. climatology as complied by NOAA, included an assessment for the historically active 2020 hurricane season, and climatological statistics for all of 2020:
https://www.ncei.noaa.gov/news/national-climate-202012
Assessing the U.S. Climate in 2020
Contiguous U.S. ranked fifth warmest during 2020; Alaska experienced its coldest year since 2012

Courtesy of Pixabay.com
For 2020, the average contiguous U.S. temperatureThe five warmest years on record have all occurred since 2012 was 54.4°F, 2.4°F above the 20th-century average, ranking fifth warmest in the 126-year period of record. The five warmest years on record have all occurred since 2012.
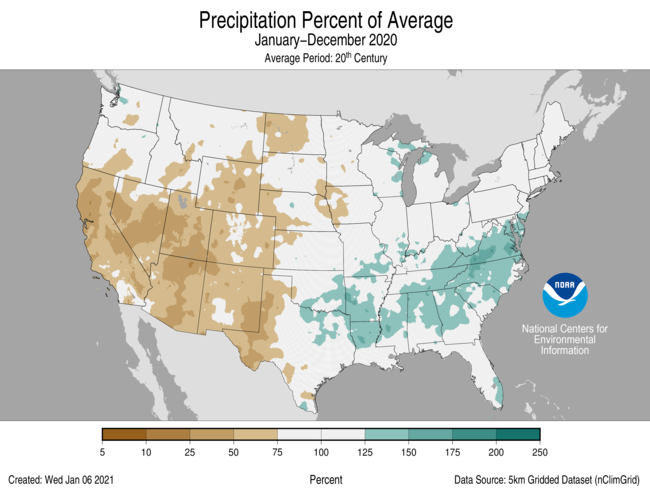
The annual precipitation total for the contiguous U.S. was 30.28 inches, 0.34 inch above average, ranking in the middle third of the historical record.
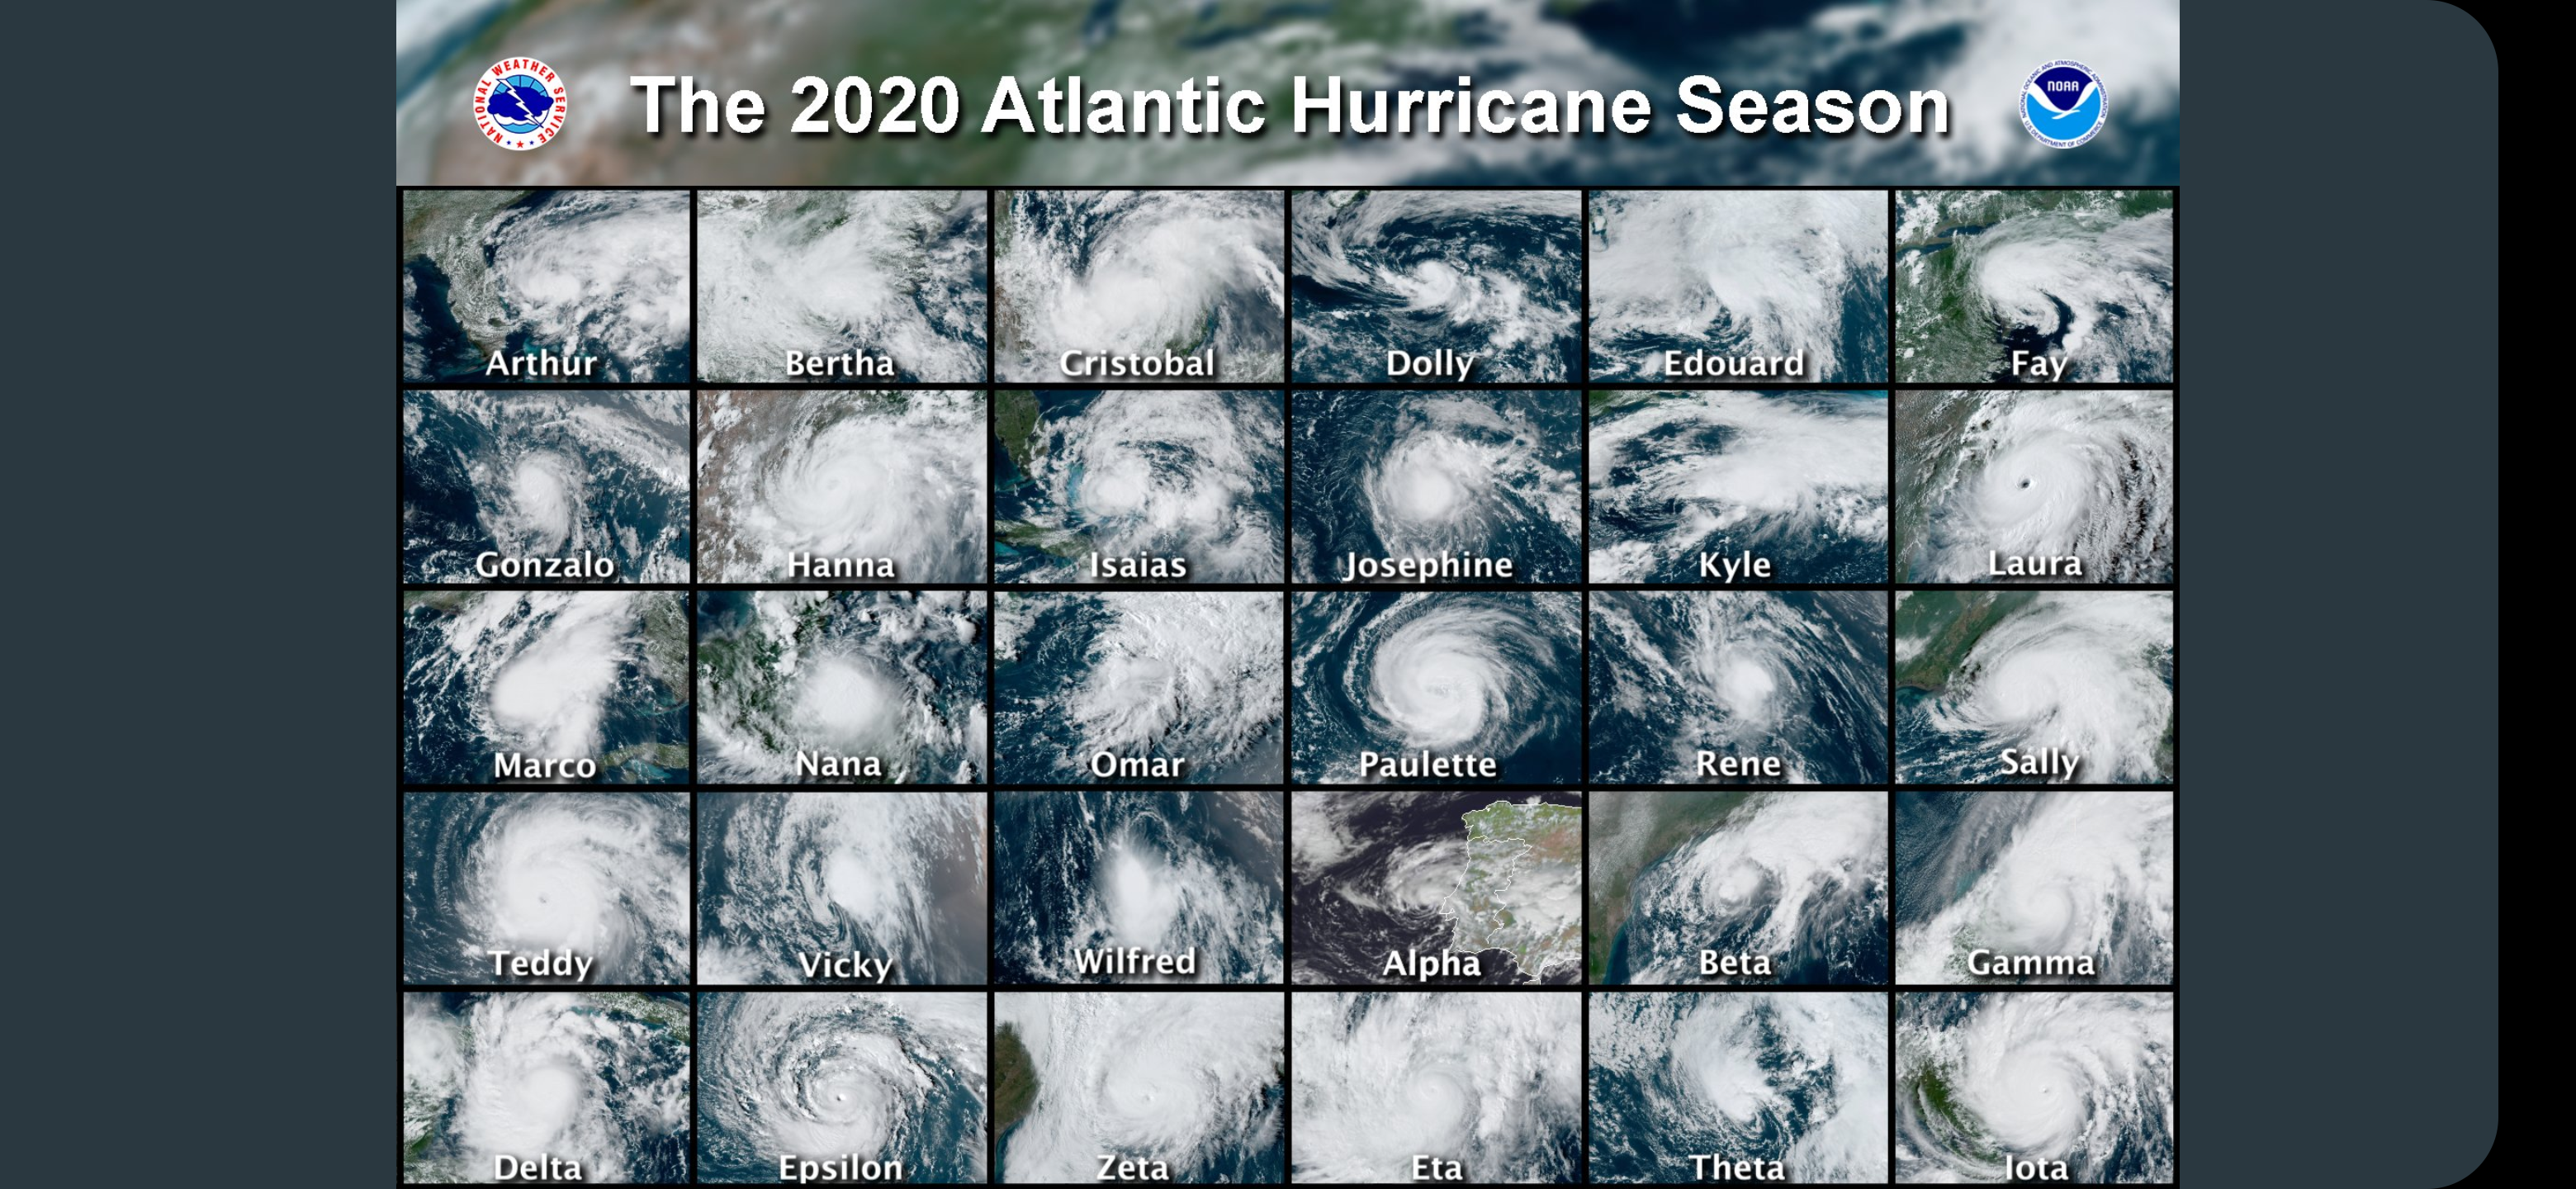
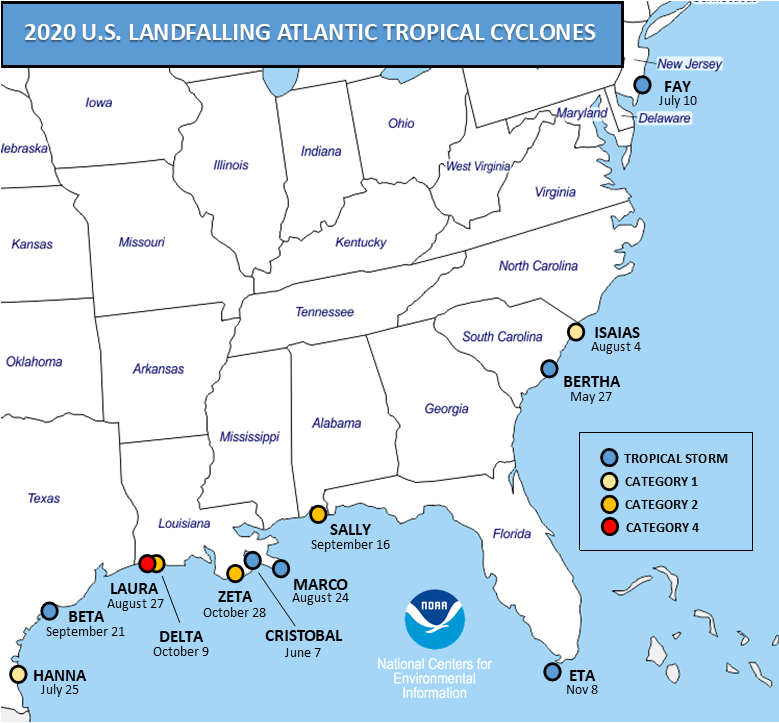
During 2020, several North Atlantic hurricane season records were broken. Thirty named storms formed which breaks the previous record of 28 set in 2005. Twelve named U.S. storm continental landfalls occurred during 2020. This breaks the previous annual record of nine landfalls set in 1916.
It was the most active wildfire year on record across the West. Five of the six largest fires in California history and the three largest fires on record in Colorado occurred during 2020.
Twenty-two separate billion-dollar disasters were identified during 2020Twenty-two separate billion-dollar disasters were identified during 2020, breaking the previous record of 16 set in 2011 and matched in 2017. Since September 2020, NCEI has identified six new disasters during 2020 including Hurricanes Hanna, Delta and Zeta; Tropical Storm Eta; and two severe storms.

This annual summary from the NOAA National Centers for Environmental Information is part of the suite of climate services NOAA provides to government, business, academia and the public to support informed decision-making.
2020 Temperature
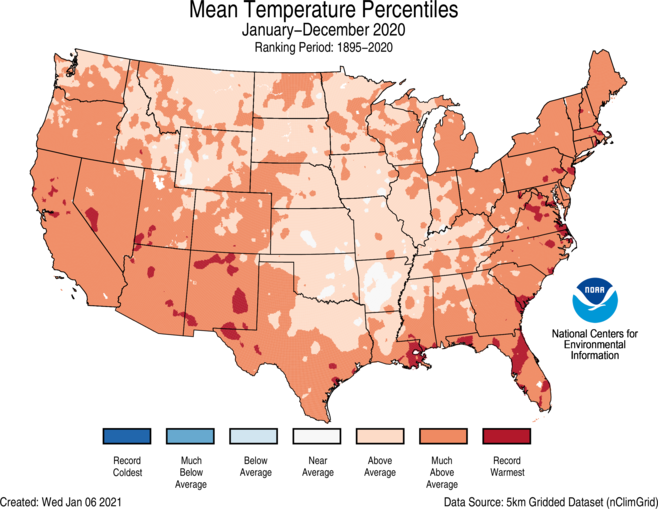
- Most of the contiguous U.S. experienced above-average temperatures during 2020. Ten states across the Southwest, Southeast and East Coast had their second-warmest year on record. There were no areas of below-average annual temperatures observed across the Lower 48 during 2020.
- Despite a cold start to the year in Alaska, the statewide average annual temperature was 27.5°F, 1.5°F above the long-term average and was the coldest year since 2012. Above-average conditions were observed across the North Slope, West Coast and the Aleutians, primarily due to the lack of coastal sea ice. Above-average temperatures were also seen in portions of Bristol Bay, Central Interior and Northeast Interior regions. Pockets of below-average temperatures occurred across parts of the Southeast Interior region.
- Influenced by warm ocean temperatures, Kahului and Hilo experienced a record-warm year in 2020.
2020 Precipitation
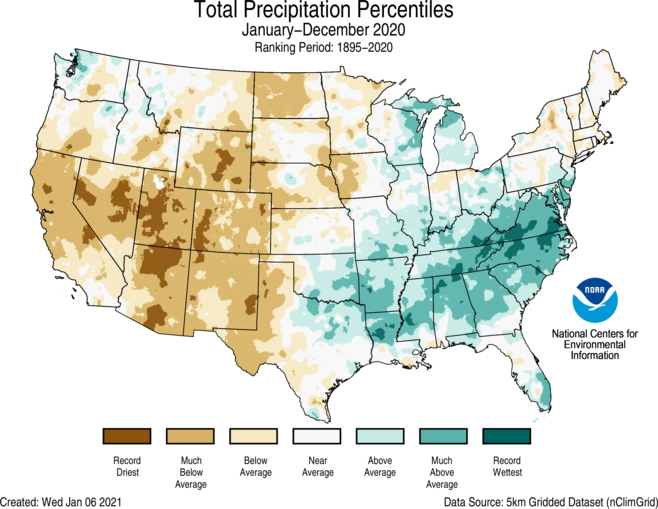
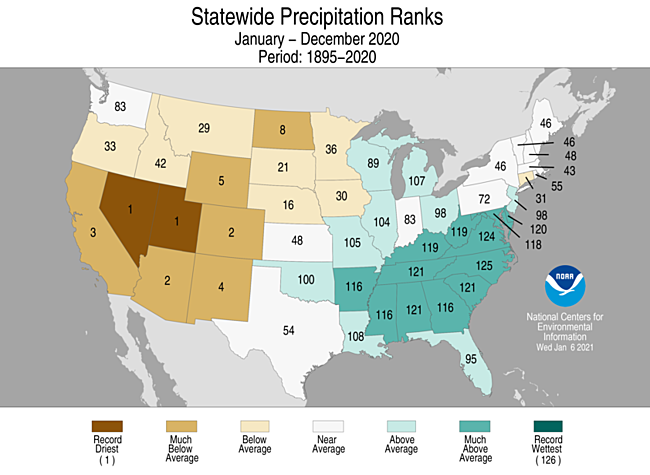
- Above-average annual precipitation was observed from the Great Lakes and Plains to the Southeast and Mid-Atlantic regions. North Carolina had its second-wettest year on record during 2020 and Virginia was third wettest. Below-average precipitation fell across much of the West, northern Plains and parts of the Northeast. Nevada and Utah ranked driest on record for 2020 with two additional western states ranking second driest.
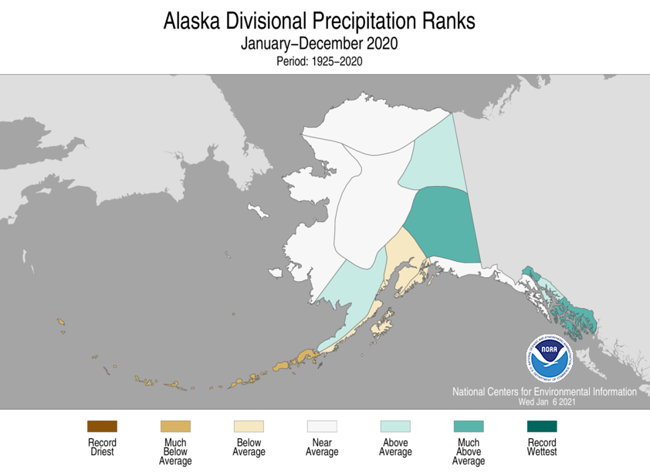
- Precipitation received across Alaska during 2020 varied by region with the eastern interior regions, portions of the Panhandle and Bristol Bay receiving above-average precipitation. Meanwhile, parts of northwestern Alaska, the Aleutians and the central Gulf regions received below-average precipitation for the year.
- According to the U.S. Drought Monitor (USDM), drought coverage expanded throughout much of 2020 with a minimum CONUS extent of 9.6 percent occurring on February 18 and maximum coverage of approximately 50 percent on December 22. Extreme (D3) and exceptional (D4) drought covered about 22 percent of the CONUS on December 29 — the largest extent of D3 and D4 drought since August 2012 (24 percent). Drought conditions expanded or intensified across much of the western U.S. and southern to central High Plains throughout 2020 with persistent above-average temperatures and precipitation deficits in place across much of the West. Much of New England experienced the emergence of drought during the second half of 2020 with marked improvement by the end of the year. Hawaii’s peak drought extent occurred during November with approximately 74 percent coverage. June and July were Puerto Rico’s most significant drought months with over 50 percent coverage; Alaska was nearly drought free during most of 2020.
2020 Billion Dollar Disasters and Other Notable Extremes
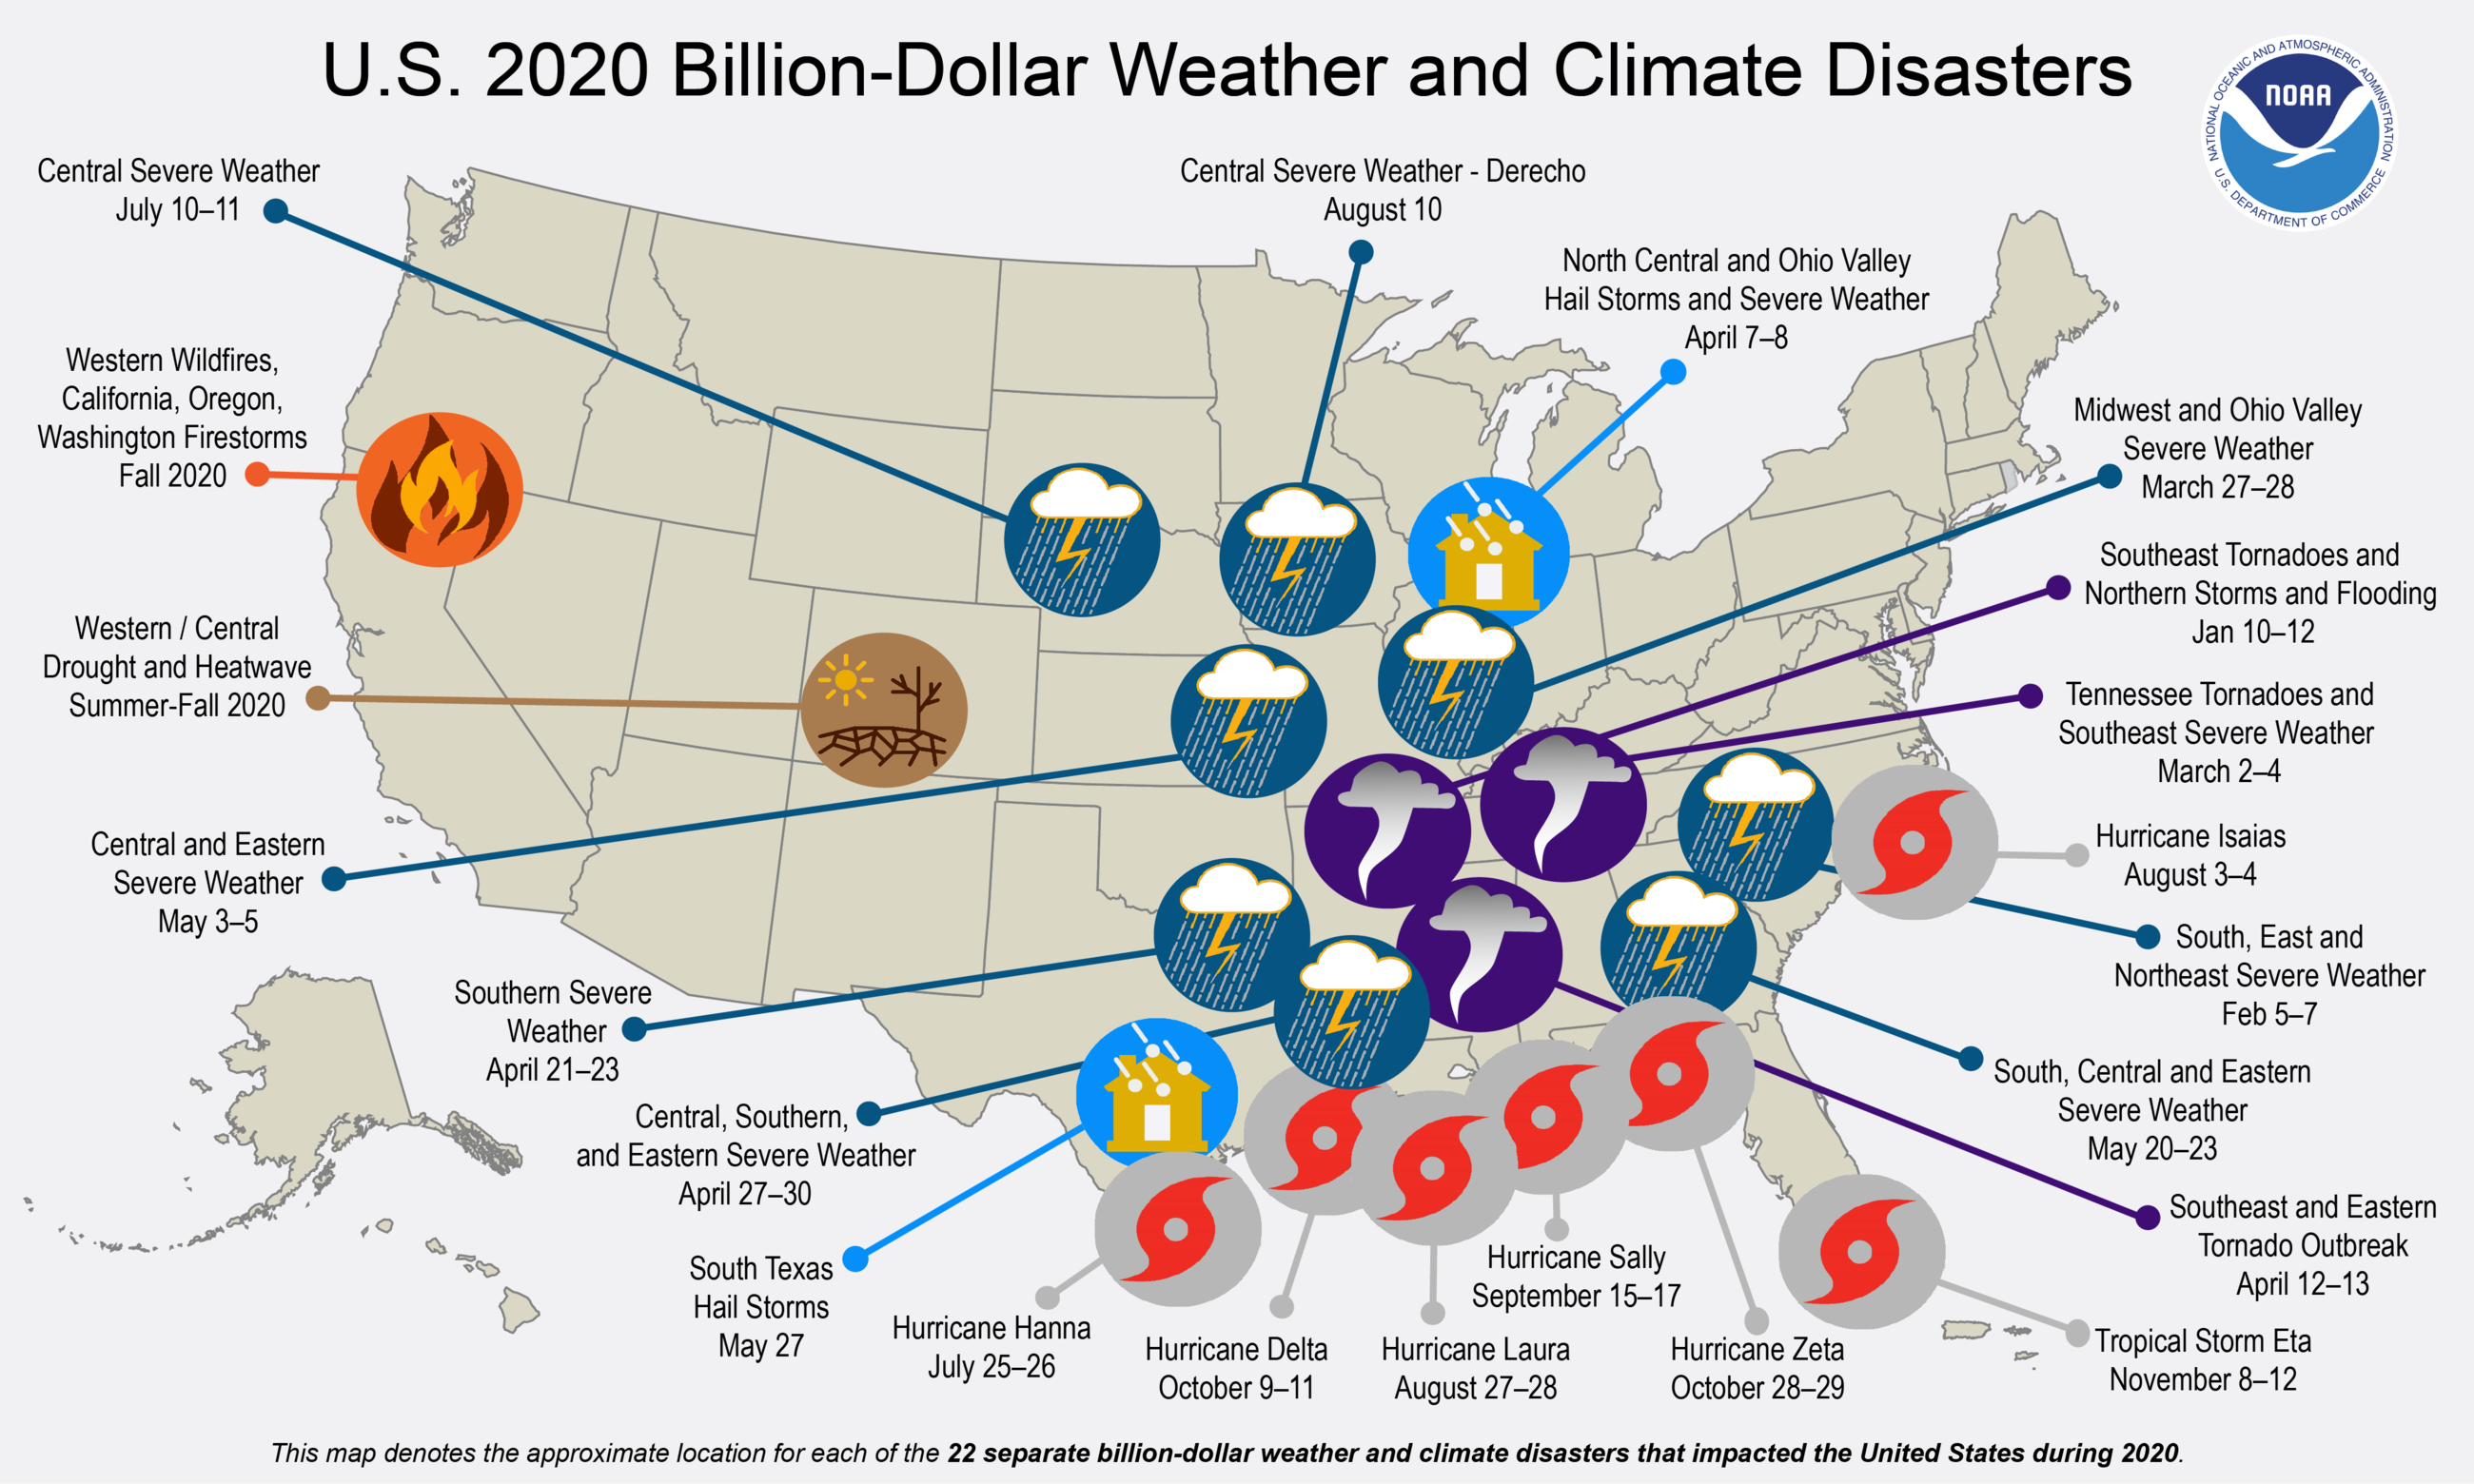
In 2020, there were 22 weather and climate disaster events with losses exceeding $1 billion each across the United States — shattering the previous annual record of 16 events that occurred in 2011 and 2017. These events included seven tropical cyclone events, 13 severe storm events, one drought and one wildfire event.
- Annual losses in 2020 exceeded $95 billion, the fourth highest cost on record. The most costly events of the year include: Hurricane Laura, the Western wildfires and the Midwest derecho.
- Seven of the 12 landfalling tropical systems each produced at least $1 billion in damage, breaking the old record of four separate billion-dollar tropical cyclones in both 2004 and 2005.
- The Central states also experienced a historic severe weather event — the August 10 derecho — that produced damage estimated at $11.0 billion. The derecho’s damage to infrastructure and crops is the third severe weather event (since 1980) with CPI-adjusted costs over $10.0 billion, joining the late-April and May 2011 tornado super outbreaks across the Southeastern and Central states.
- The total cost of U.S. billion-dollar disasters over the last five years (2016-2020) exceeds a record $600 billion.
- 2020 also marks the sixth consecutive year (2015-20) in which 10 or more separate billion-dollar disaster events have impacted the U.S.

Through November 30, and the official end of the North Atlantic hurricane season, several records were tied or broken.
- Thirty named storms formed, which breaks the previous record (1950 to present) of 28 set in 2005. The 13 hurricanes and six major hurricanes in 2020 are both the second most on record behind 2005 (15 and 7, respectively).
- Twenty-seven of the 30 named storms were the earliest named storm, for their respective number, on record.
- Twelve named U.S. storm continental landfalls occurred during 2020. This breaks the previous annual record of nine landfalls set in 1916.
- Six hurricanes made U.S. landfall, tying 1886 and 1985 for the most U.S. hurricane landfalls in a single season.
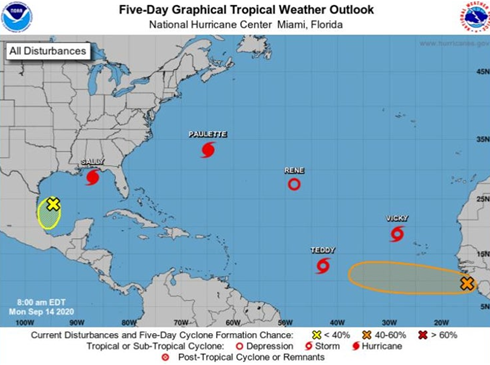
- On September 14, five tropical cyclones were active at the same time in the Atlantic. This ties September 1971 for the most storms to be active at once on record.
- Category 5 Hurricane Iota formed during November and was the most intense Atlantic hurricane of the season. Iota was also the second-strongest November hurricane on record for the Atlantic and was the strongest Atlantic hurricane on record to occur so late in the calendar year.
- This was a record fifth consecutive year with at least one Category 5 storm in the Atlantic.
- Five Category 4 and 5 storms formed in the Atlantic during 2020, tying with 1933, 1961, 1999 and 2005 for the record.
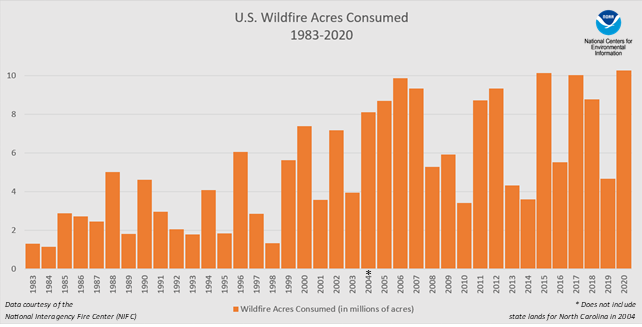
- 2020 was the most active wildfire year on record (1983 to present) across the West. Nearly 10.3 million acres were consumed during 2020, exceeding the 2000-2010 average by 51 percent. This was the largest acreage consumed in the U.S. since at least 2000.
- The three largest wildfires in Colorado history occurred during 2020: The Cameron Peak Fire, the East Troublesome Fire and the Pine Gulch Fire each exceeded the acreage burned by the previous record, the 2002 Hayman Fire.
- Approximately four percent of California’s nearly 100 million acres were consumed by wildfires in 2020, which is the largest wildfire season on record for the state. Five of the six largest wildfires in California history also occurred during 2020. The August Complex, SCU Lightning Complex, Creek Fire, LNU Lightning Complex and the North Complex burned nearly 2.5 million acres in all. More than 4.3 million acres were consumed across California during 2020.
- With many of these large fires burning simultaneously, heavy smoke and poor air quality impacted many of the western states and Canada over many days during September.
- Wildfire activity across Alaska was below average and consumed approximately 181,000 acres in 2020 — only 15 percent of the 2010-2019 average. Although the season was below average, it was more than the 1993-2020 minimum of 23,000 acres set in 2004.
- Snowfall during the 2019-2020 snow season was below average across the Sierra Nevada range, the western coastal ranges, Cascades, the northern and central Plains, portions of the Great Lakes and across parts of the mid-Atlantic and Northeast. In contrast, some places experienced their snowiest season on record. Boulder, CO, received 152 inches of snow. Caribou, ME, also had significant snow during the 2019-2020 season, receiving 146 inches and ranking ninth highest for any season on record.
- The 2020 tornado count was slightly below average across the contiguous U.S. with approximately 1,200 tornadoes reported. The most notable event during the year was an outbreak of at least 140 tornadoes from Texas to Maryland April 12-13. With 32 tornado-related fatalities reported, this was the deadliest tornado outbreak across the U.S. since April 27-30, 2014. No EF-5 tornadoes were reported during 2020. The most recent tornado classified as an EF-5 occurred in 2013.
- The U.S. Climate Extremes Index (USCEI) for 2020 was 80 percent above average and ranked as seventh highest in the 111-year record. Warm extremes in both maximum and minimum temperature across much of the U.S. in addition to wet conditions across the Southeast and dry conditions in the West contributed to this elevated USCEI value. The USCEI is an index that tracks extremes (falling in the upper or lower 10 percent of the record) in temperature, precipitation, drought and landfalling tropical cyclones across the contiguous U.S.
*Temperature and precipitation values and ranks are based on preliminary data. Additional data received and processed after the release of this summary may result in small differences for annual values and ranks.
Here is more climate and weather news from Friday:
(As usual, this will be a fluid post in which more information gets added during the day as it crosses my radar, crediting all who have put it on-line. Items will be archived on this site for posterity. In most instances click on the pictures of each tweet to see each article. The most noteworthy items will be listed first.)
Now here are some of today’s articles and notes on the horrid COVID-19 pandemic:
(If you like these posts and my work please contribute via the PayPal widget, which has recently been added to this site. Thanks in advance for any support.)
Guy Walton “The Climate Guy”