Thursday December 31st… Dear Diary. The main purpose of this ongoing blog will be to track United States extreme or record temperatures related to climate change. Any reports I see of ETs will be listed below the main topic of the day. I’ll refer to extreme or record temperatures as not extraterrestrials).😉
Main Topic: NCEI Global and National Record Count And Ratio Summaries At The End Of 2020
Dear Diary. I shulda coulda woulda have thought to do this years ago, but since the National Center for Environmental Information record count system does not archive global summary data annually, “snapshots” need to be taken at the end of each year. Tomorrow on 1/1/2021 poof…the tallied summary from all of 2020 will disappear and be gone. Of course, if you have been following my work, national monthly and yearly summaries are stored in my archive here:
NCEI Record Count Archive – Guy On Climate
This year end summary, as well as those going forward, can also be found in the above link to keep track of global numbers and summaries.
Here is my NCEI global summary graphic for 2020 made on the last day of the year to get the maximum number of record counts or reports:

And the national summary:
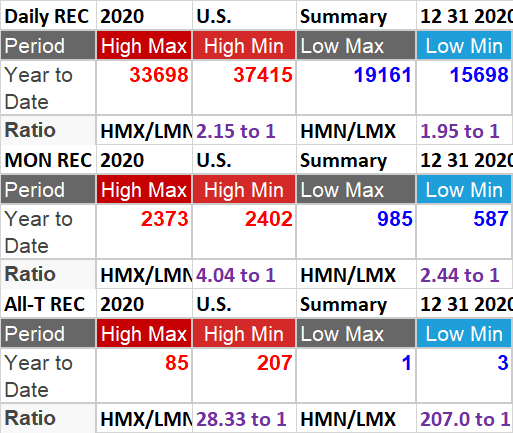
Keeping in mind that global average temperatures for 2020 were roughly +1.2°C above preindustrial conditions, we see that the ratio of global daily high max to low min records (including ties) is roughly 2.58 to 1. Other ratios are noted in the above two charts. We can note that, once more like the last few years, U.S. national ratios for monthly and daily records are slightly below global ratios. This would imply that the United States is heating up a bit more slowly than the rest of the globe, but we don’t know why. Also, there is more evidence of the global warming signature of nights warming faster than days looking at how HMN numbers exceed HMX numbers in both datasets.
It will be interesting to see how these ratios move up as global averages rise the rest of this century. We are focused on the daily HMX to LMN because of the following scientific paper I was a part of:
https://agupubs.onlinelibrary.wiley.com/doi/full/10.1029/2009GL040736
It is my sincere hope to make a summary at the end of 2021 should the NCEI record count system not improve and/or change. If I’m not physically able I hope other scientists will carry on my work. Starting with 2020 I’m archiving each end of year summery in my NCEI Record Count Archive on this site.
What is the bottom line purpose for this record research that has become my life’s work? It’s important to see how much more record heat we can expect on the planet with each seemingly minuscule uptick in global average temperatures so that experts and those with political power can best prepare populations for the future of the climate crisis.
Related:
Here is more climate and weather news from Thursday:
(As usual, this will be a fluid post in which more information gets added during the day as it crosses my radar, crediting all who have put it on-line. Items will be archived on this site for posterity. In most instances click on the pictures of each tweet to see each article.)
Now here are some of today’s articles and notes on the horrid COVID-19 pandemic:
(If you like these posts and my work please contribute via the PayPal widget, which has recently been added to this site. Thanks in advance for any support.)
Guy Walton- “The Climate Guy”