The main purpose of this ongoing blog will be to track United States extreme or record temperatures related to climate change. Any reports I see of ETs will be listed below the main topic of the day. I’ll refer to extreme or record temperatures as ETs (not extraterrestrials).😉
Main Topic: Another Case Of Sudden Stratospheric Warming Leading To Very Cold, Snowy Weather?
Dear Diary. For those of you following along on this blog, taking a pseudo meteorology and climatology 101 course, I bet you did not know that when the stratosphere warms large areas of the troposphere where we live and breathe cool. We now know that one thing to look for, as far as global warming trends go, is counterintuitive stratospheric cooling. Still, since our climate is not totally wrecked yet, we can get times of sudden stratospheric warming, which can lead to weather patterns of anomalous cold with harsh winter storms.
Bob Henson, who has brilliantly written on climate change, has tweeted out a good source for these “SSW” events:
Here is more from:
https://csl.noaa.gov/groups/csl8/sswcompendium/
Chemistry & Climate Processes: Products
SSWC: Sudden Stratospheric Warming Compendium data set
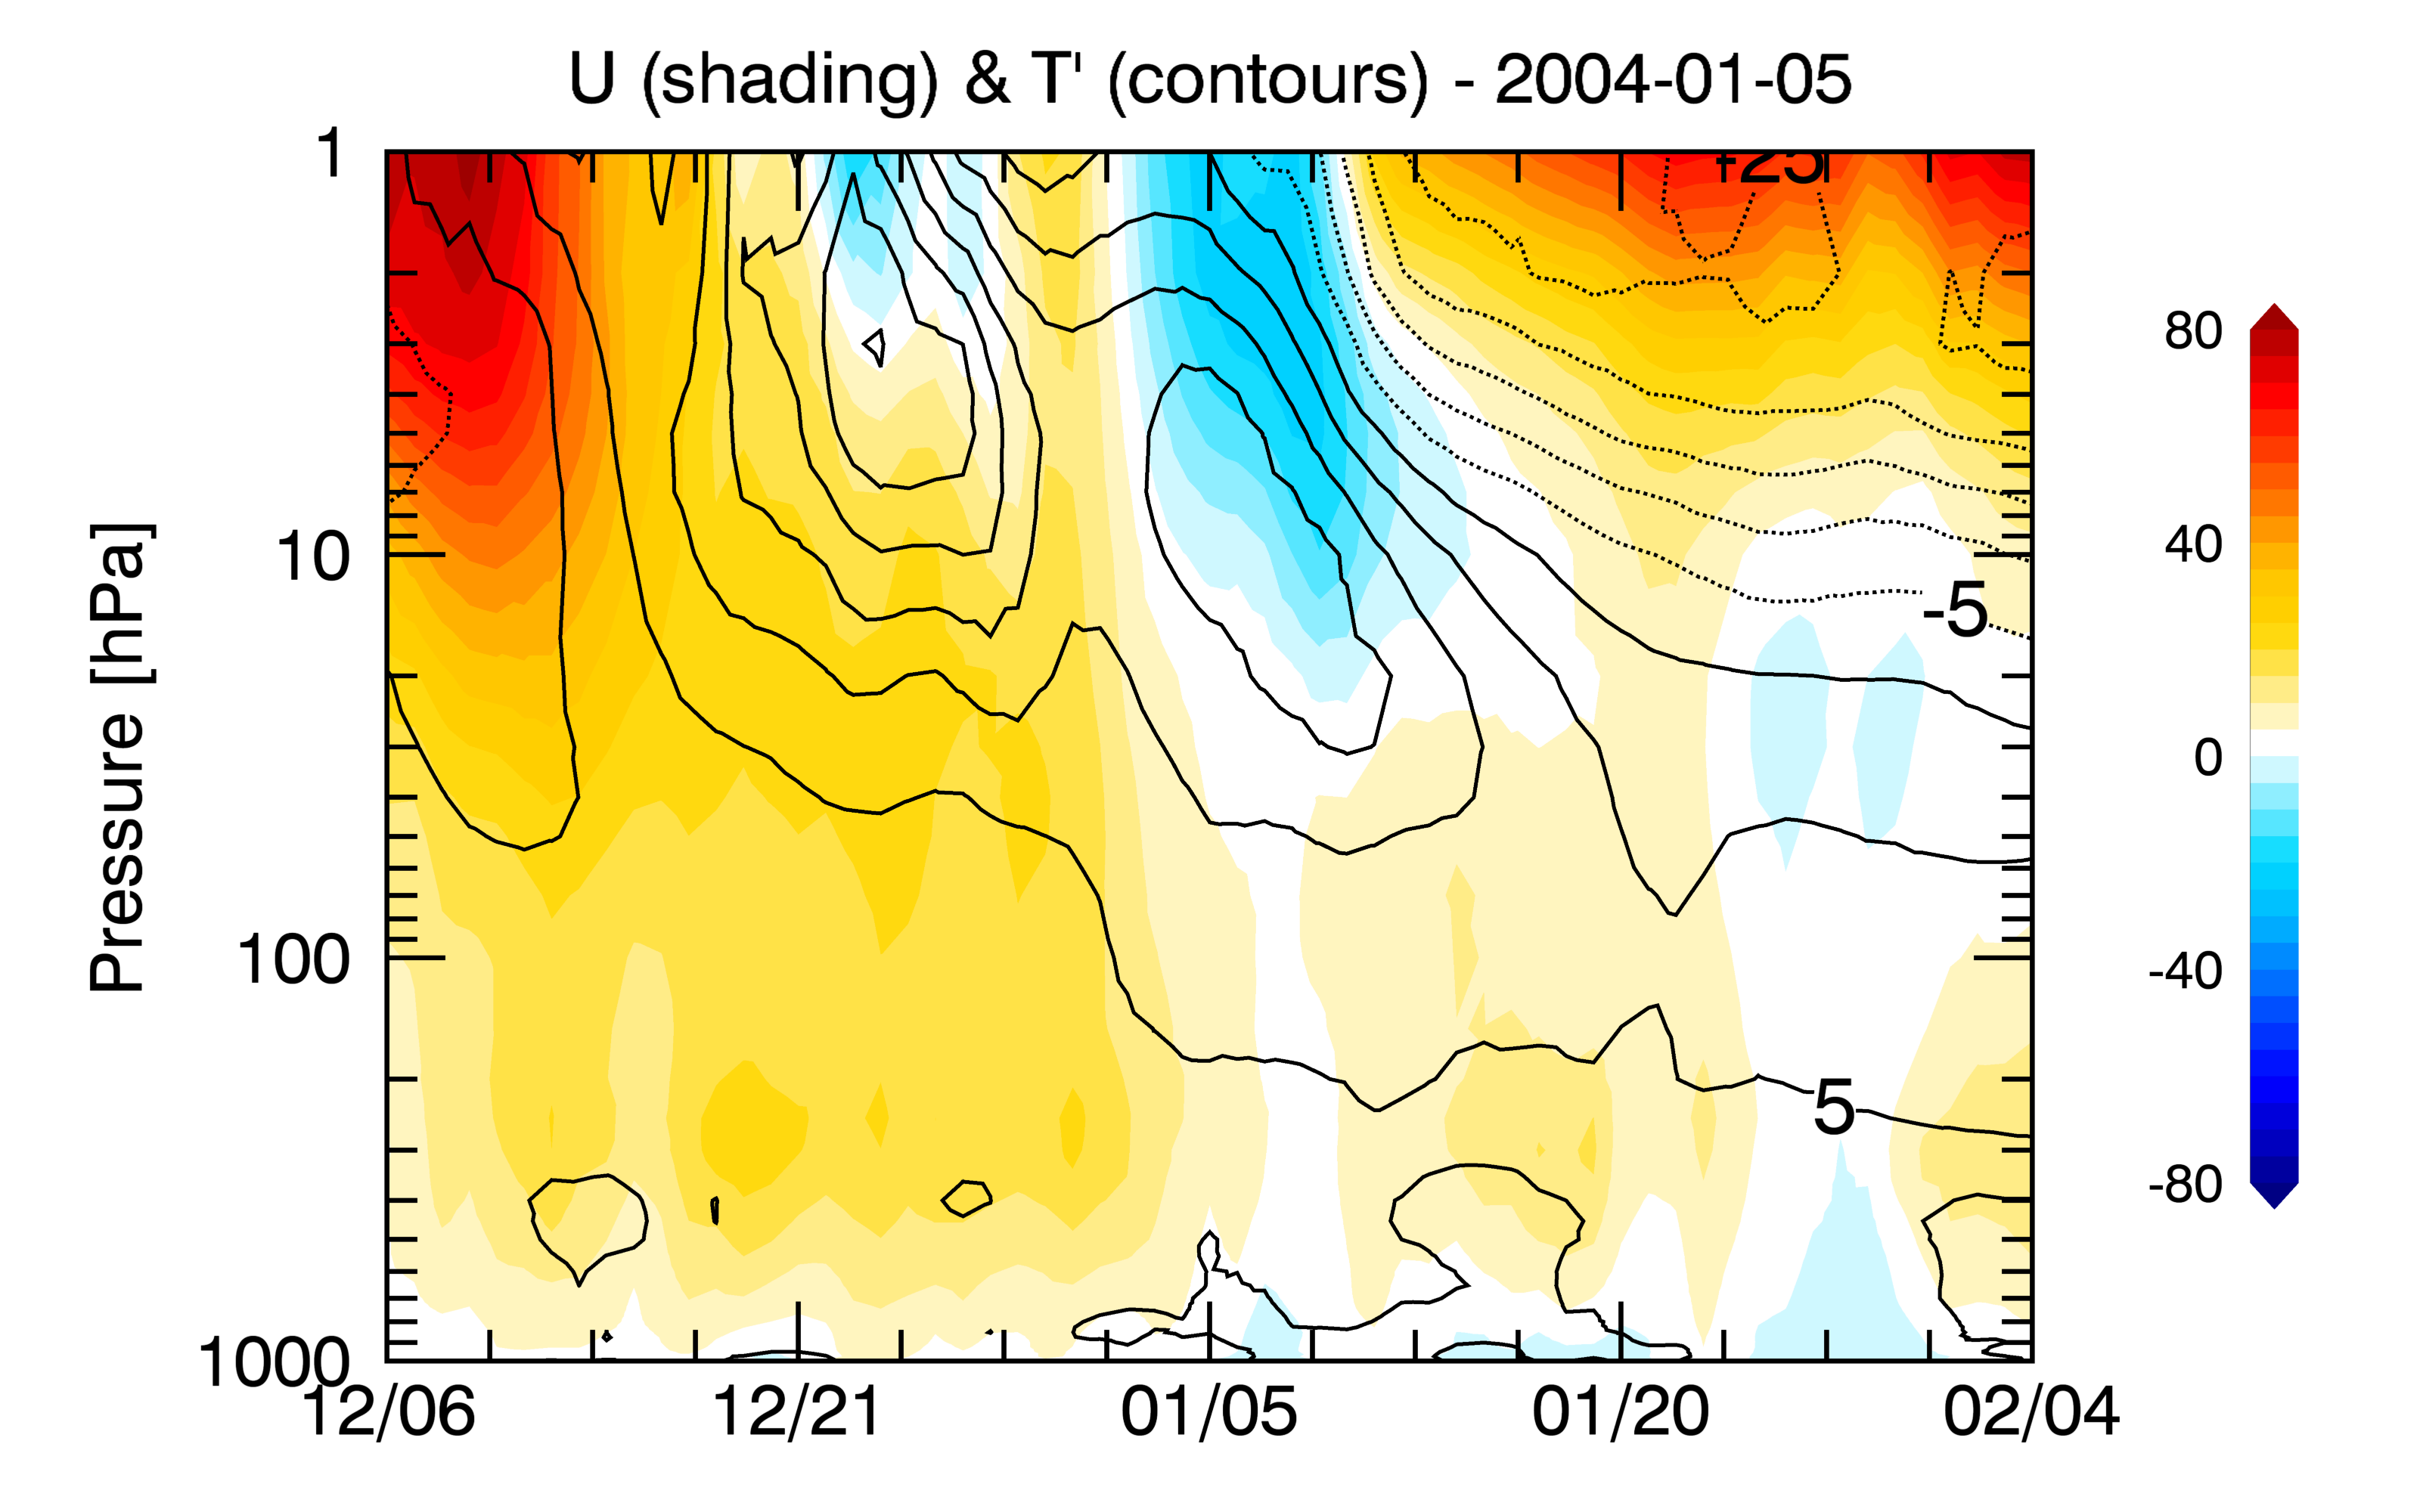
Sudden stratospheric warmings (SSWs) are large and rapid temperature increases in the polar stratosphere associated with a complete reversal of the climatological westerly winds in wintertime. These events can have substantial impacts on wintertime surface climate, such as extreme cold air outbreaks over North America and Eurasia, or warming over Greenland.
This compendium of historical SSWs documents the stratospheric, tropospheric, and surface climate impacts of these events, both individually and composited, using a variety of time series, maps, and animations of daily data. Here, we examine only major mid-winter warmings, as defined by a zonal wind reversal between November-March of the 10 hPa and 60N zonal winds from westerly to easterly (Charlton and Polvani 2007). Additional events, such as minor and final warmings, may eventually be included.
Analyses are available from 6 different reanalyses: MERRA2 (1980-2014), JRA-55 (1958-2014), ERA-interim (1979-2014), ERA-40 (1958-2002), NOAA20CR (1958-2011), and NCEP-NCAR I (1958-2014). Anomaly fields are calculated from smoothed daily climatologies based on the full record of each reanalysis. Data is provided 60 days prior to and after each event.
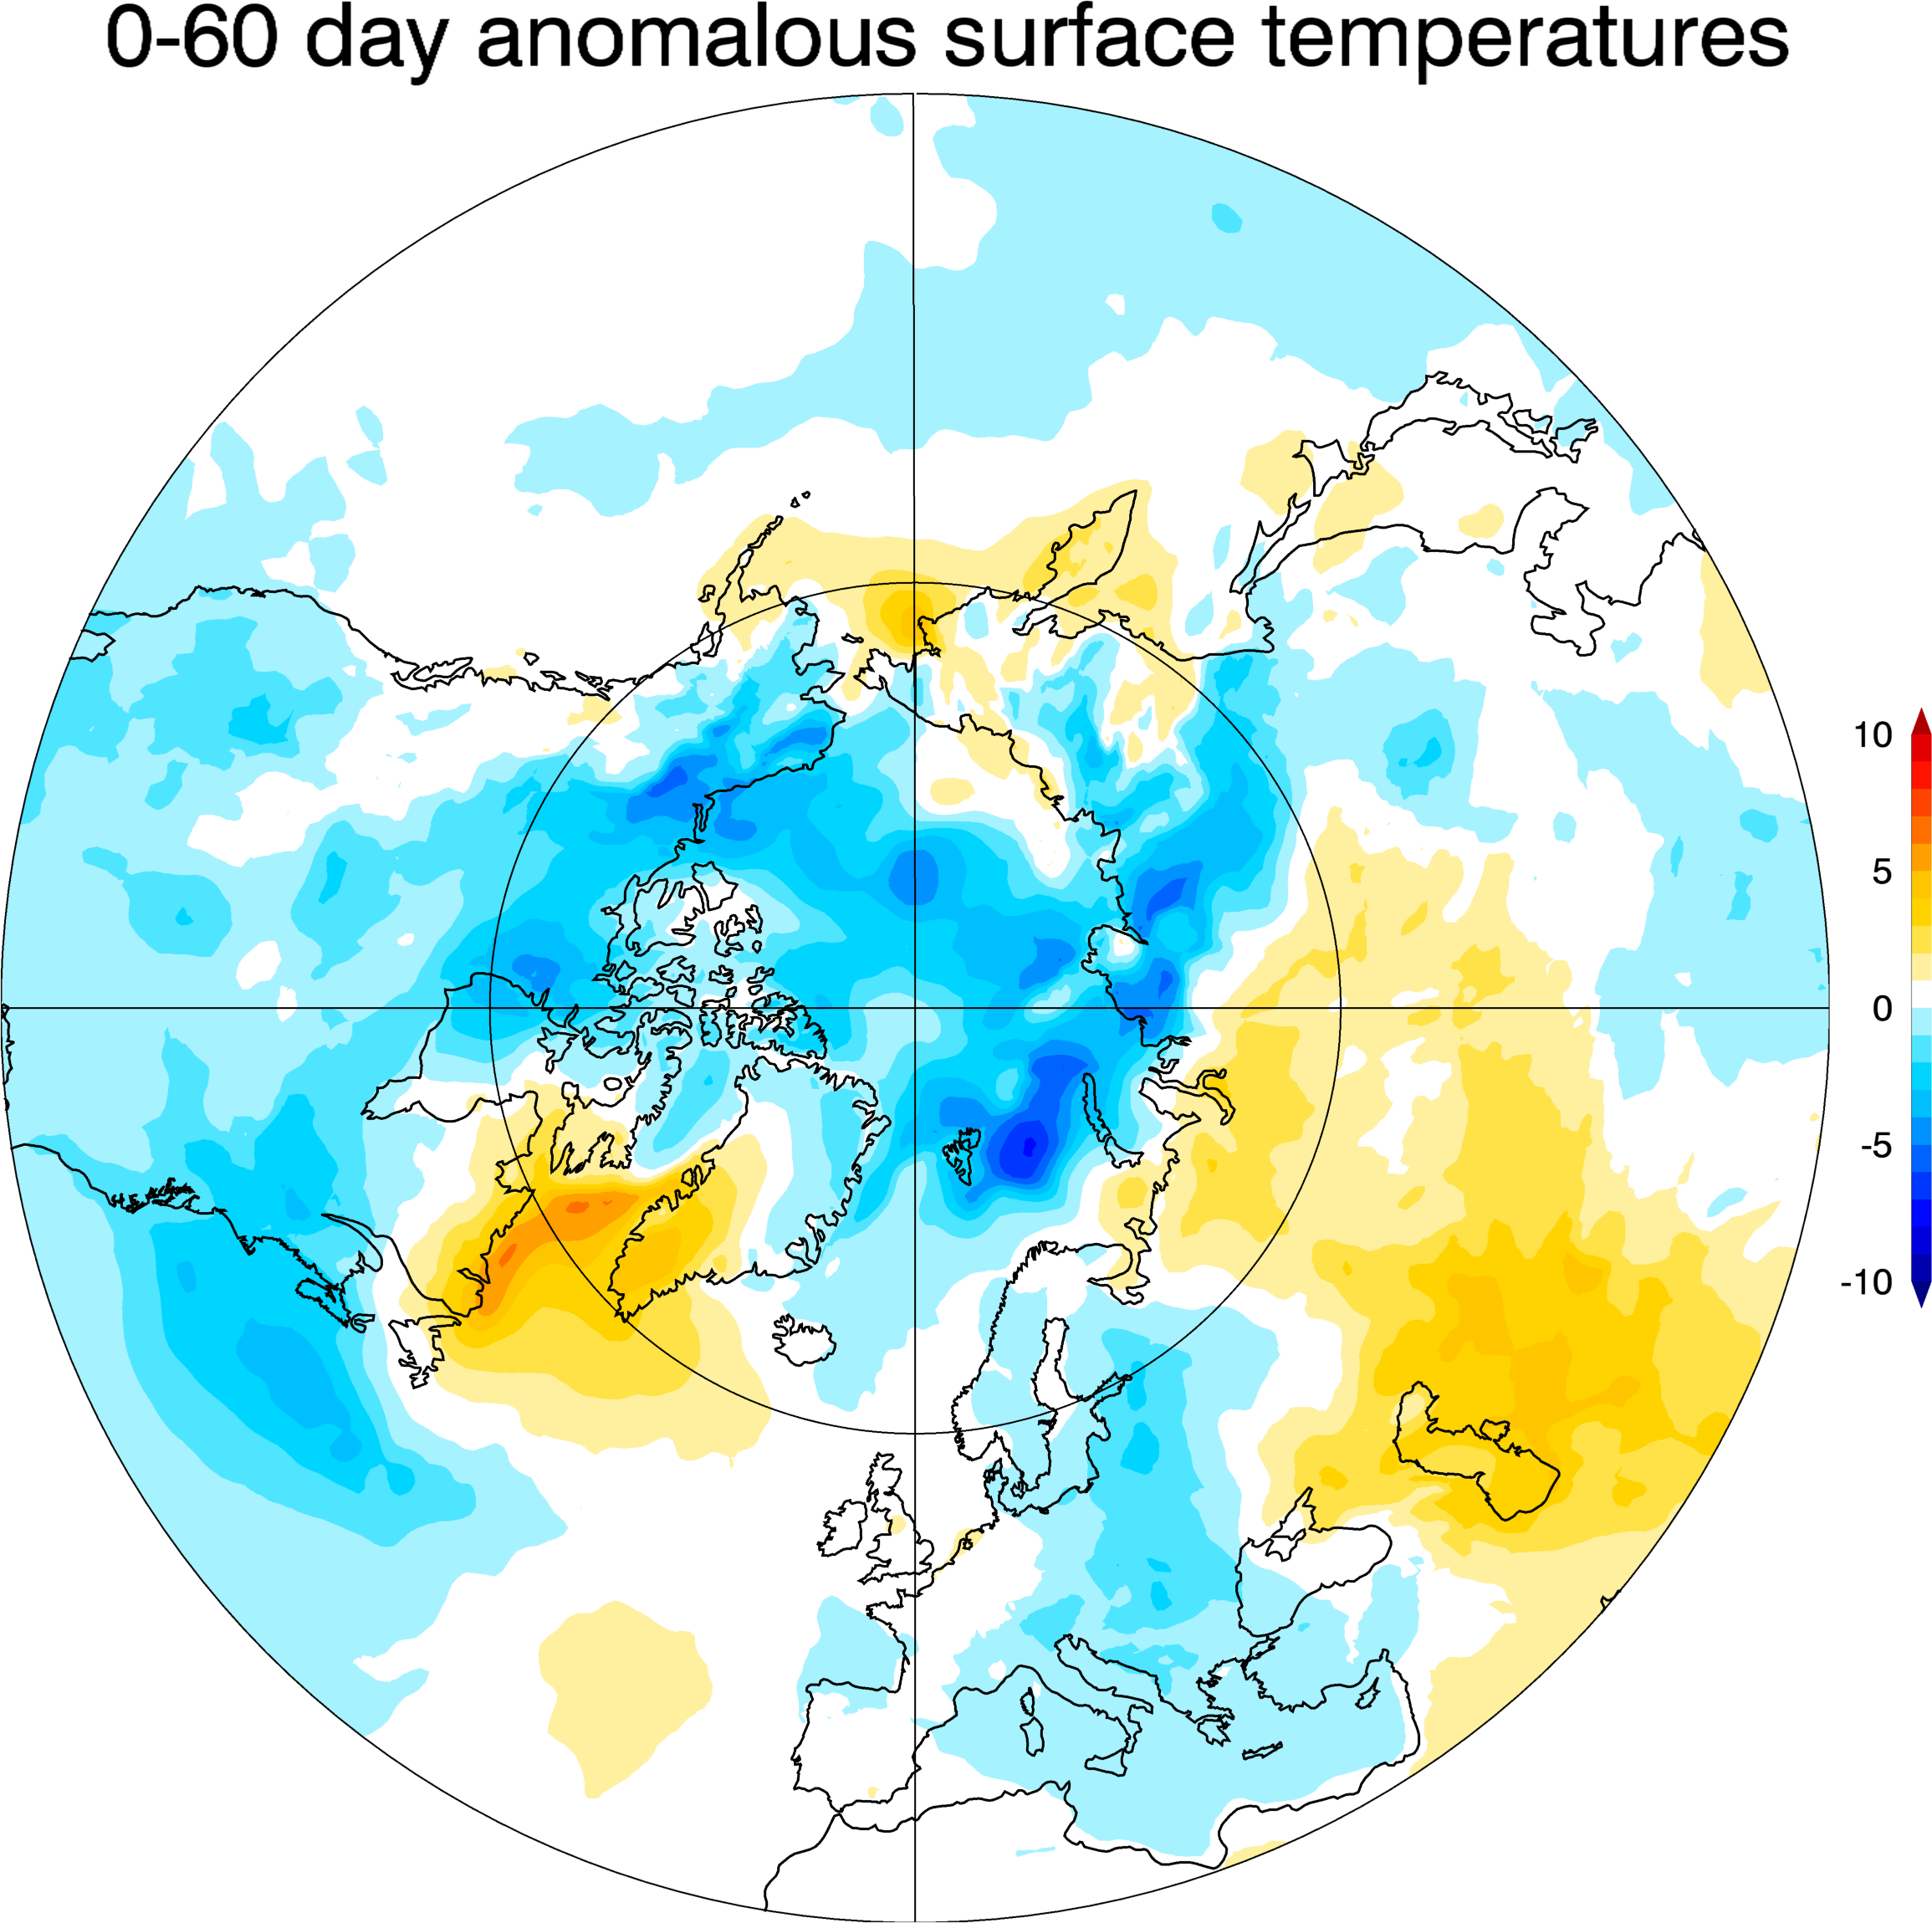
Average surface temperature anomalies for the 60 days following the 2004 Jan 5 warming event.
The Sudden Stratospheric Warming Compendium (SSWC) database provides a simple way to plot and download information on historical SSW events; to consider the development, evolution, and impacts of both individual SSWs and their composite; and to provide a basis for model evaluation and improvement.
Point of Contact: Amy Butler, NOAA
Documentation
SSWC User’s Guide PDF file
SSWC Production Guide PDF file
SSWC API Guide PDF file
Table of major mid-winter SSWs in reanalyses products
Data Use Policy
These SSWC data are made freely available to the public and the scientific community, and are the product of extensive research and effort to maintain and improve their accuracy and quality. However, the availability of these data does not constitute publication, and NOAA Chemical Sciences Division (CSD) and their collaborating partners require citable outputs from their research to ensure its continued support. We therefore expect all users of this data to ensure that the responsible scientists receive fair credit for their work, and are offered the opportunity to contribute to the research uses of the data as they deem appropriate.
Accordingly, we ask that all users note and adhere to the following guidelines and procedures when using these data:
- These data are freely available for exploratory analysis. At such time as a journal publication or conference presentation is planned using these data, the Compendium collaborators (Amy Butler and Jeremiah Sjoberg) should be informed of the nature and aims of the research project and the intended use of the data.
- Contacting the Compendium collaborators will ensure they have adequate foreknowledge of the proposed research and thus the opportunity to contribute as appropriate to the use of SSWC data in the proposed research project.
- If the Compendium collaborator makes a significant intellectual contribution to the research, co−authorship would normally be expected. This should be discussed at an early stage in the work.
- Manuscripts using the data with NOAA co−authors should be sent to the coauthors for review well before (e.g. 4 weeks) they are submitted for publication, to ensure that the quality and limitations of the data are accurately represented and the coauthors have adequate time to provide input.
- Cite this data set when used as a source: Butler, A. H., J. P. Sjoberg, D. J. Seidel, and Karen H. Rosenlof, A sudden stratospheric warming compendium, Earth Syst. Sci. Data, doi:10.5194/essd-9-63-2017, 2017.
- Cite the original data creators for each reanalysis used from the SSWC. See the Input data description section of the User’s Guide PDF file for the appropriate citations.
Please click on this link to browse data and events:
https://csl.noaa.gov/groups/csl8/sswcompendium/
It looks like we will have another SSW event going into January 2021. If so, in the United States we should see some anomalously cold, wintry weather, perhaps lasting through the rest of the winter. One sign of SSW is the development of a strong negative North American Oscillation with a Greenland Block, or ridge at 500 millibars, developing over Greenland. Here is a scenario that looks plausible valid for the last few days of December:
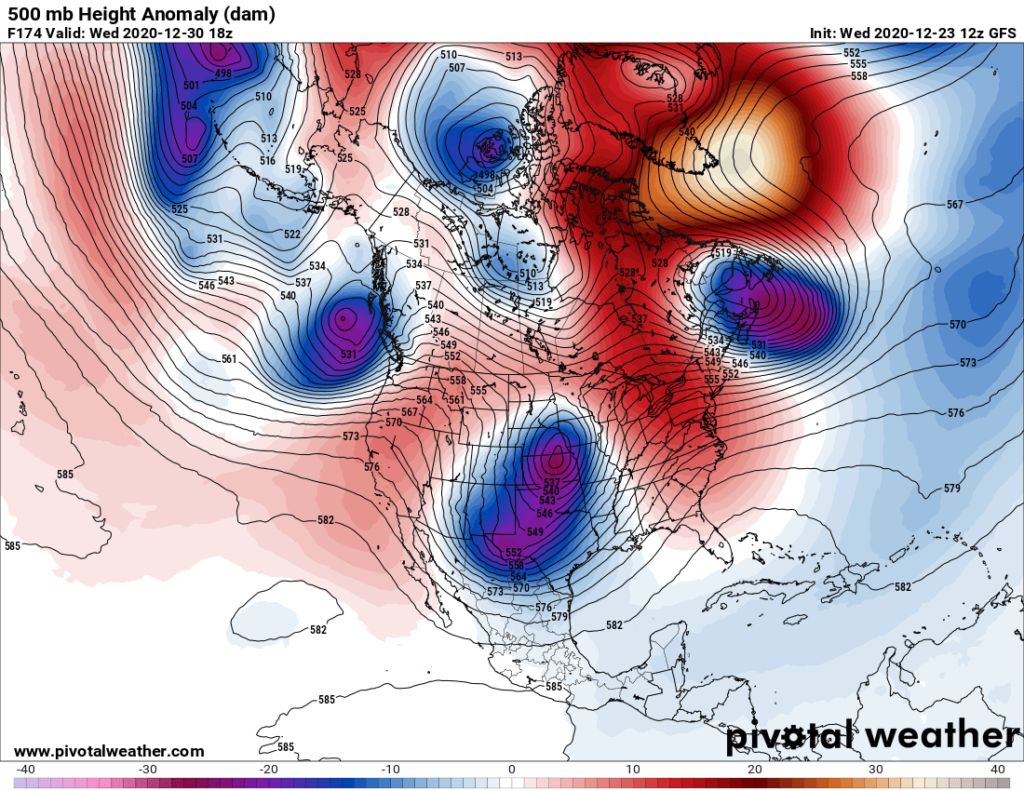
Note the anomalous warmth building towards Greenland depicted in orange colors and associated wavy, amplified jet stream pattern across the Northern Hemisphere. This pattern should allow for arctic air to penetrate deep into lower latitudes going into January:
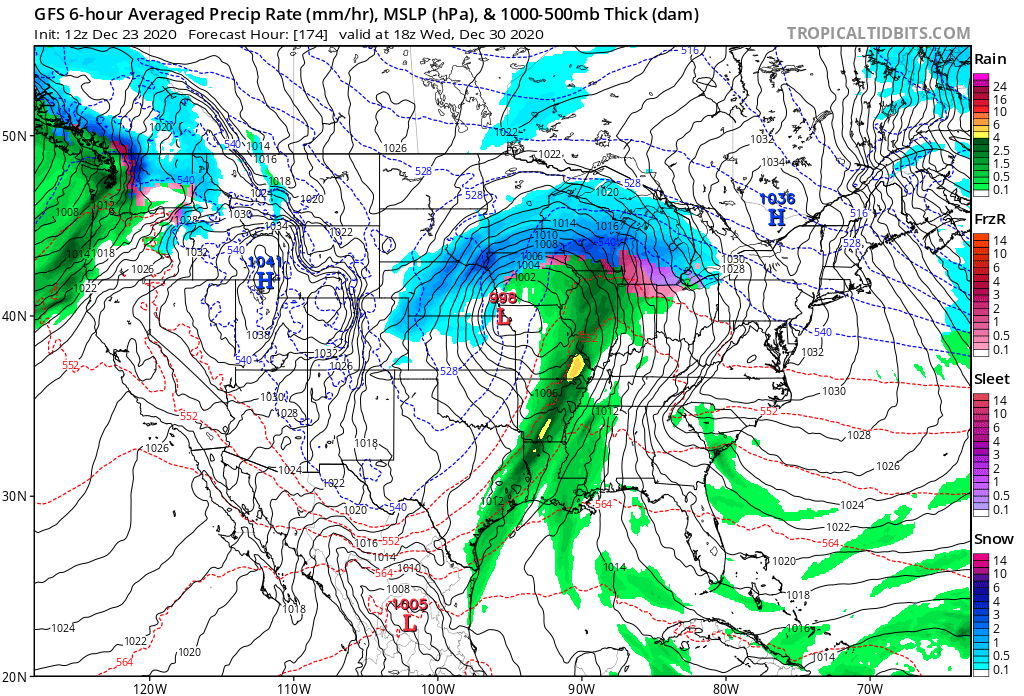
In the United States all this means in the short term is probably the development of a strong winter storm in the Plains next week with many beneficially wet storms moving into California through the West into January:
Could this upcoming weather pattern lead to widespread record chill across the United States? That’s hard to peg at this time. The last few days of met models going well out into January don’t forecast this at face value, but anytime I see a northward building ridge near the Arctic Circle in winter the prospects for a deep freeze are higher than from the opposite pattern, a positive Artic Oscillation, or cold trough over and near Greenland.
Will the coming weather pattern throw a big monkey wrench in the overall fast warming trend we have seen since 2015? Probably not, but as usual you can look for any trends on this, the Extreme Temperature Diary.
Related:
Here is more climate and weather news from Wednesday:
(As usual, this will be a fluid post in which more information gets added during the day as it crosses my radar, crediting all who have put it on-line. Items will be archived on this site for posterity. In most instances click on the pictures of each tweet to see each article. The most noteworthy items will be listed first.)
Now here are some of today’s articles and notes on the horrid COVID-19 pandemic:
(If you like these posts and my work please contribute via the PayPal widget, which has recently been added to this site. Thanks in advance for any support.)
Guy Walton “The Climate Guy”