The main purpose of this ongoing blog will be to track United States extreme or record temperatures related to climate change. Any reports I see of ETs will be listed below the main topic of the day. I’ll refer to extreme or record temperatures as ETs (not extraterrestrials).😉
Main Topic: Early August Record Scoreboard Update And Climatological Review
Dear Diary. Repeating from June: As COVID-19 ravages the United States and the globe, climate change continues to be a simmering issue, which most news sources have put on the back burner of coverage because of the pandemic. On this site, though, the climate crisis will always make headlines, because it will be with us long after this pandemic abates.
Here on this site we present monthly summaries near the 6th of each month, and each is available if you want to go back through my Extreme Temperature Diary archive.
I’m repeating my mantra from last month:
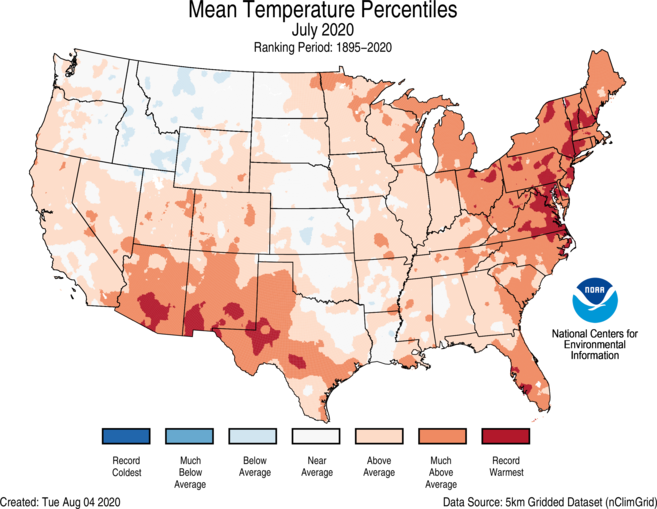
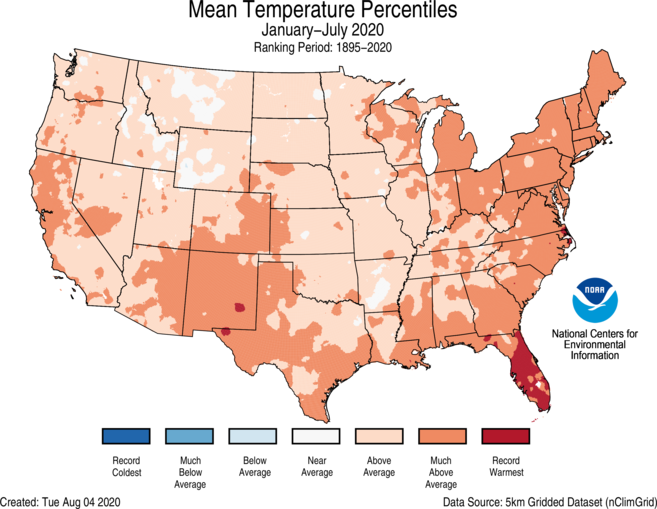
July 2020 got ranked by the National Center for Environmental Information as a well above average June, temperature wise, for the lower 48 states, coming in as 116th coolest or 11th warmest since records began being kept in 1895:
https://www.ncdc.noaa.gov/sotc/national/202007
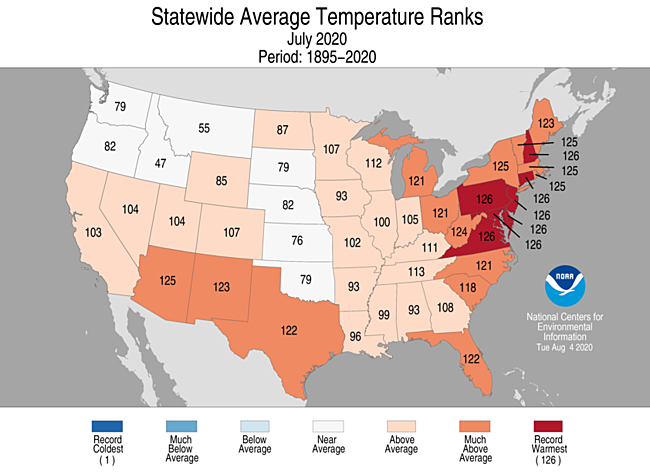
A number of states from Virginia into the Northeast saw a record warmest July. No states saw a cooler than average July. Keep in mind that these rankings all the way back to 1895, which is 126 years.
Here are my two U.S. Daily Record Scoreboards updated through 8/4/2020 (data compiled from the following NCEI site):
https://www.ncdc.noaa.gov/cdo-web/datatools/records
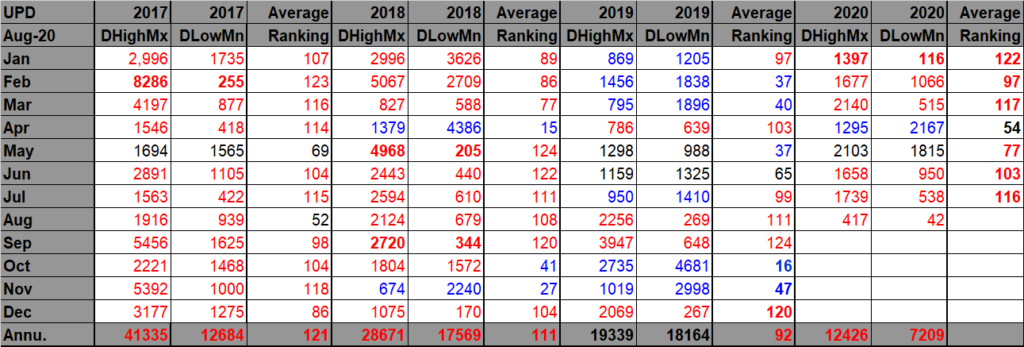
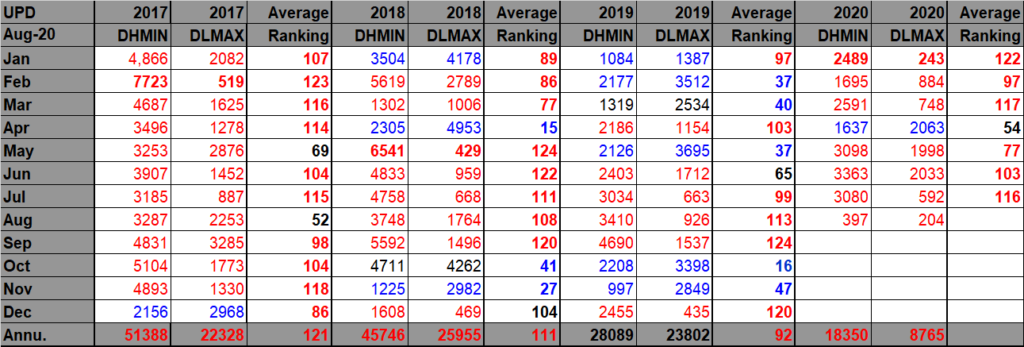
DHMX= Daily High Max Reports. DLMN= Daily Low Min Reports. DHMN= Daily High Min Reports. DLMX=Daily Low Max Reports.
For these data sets all monthly ratios of > 10 to 1 DHMX to DLMN or > 10 to 1 DLMN to DHMX are in bold type. The rankings are for the lower 48 states with the warmest ranking since 1895 of average temperatures being 125 and 1 being the coldest as of 2020. Blue colors represent cold months and red warm. Those months and years with counts close to a 1 to 1 ratio of highs to lows are colored black. Boldly colored months, such as January 2020, have ratios of more than 10 to 1 daily record highs to lows or lows to highs, and are either historically hot or cold, most of which have made news.
July 2020 had approximately a 17-5 ratio of record DHMX to DLMN individual record counts, so the color I used for this month was red on the top chart.
July 2020 had approximately a 31-6 ratio of record DHMN to DLMX individual record counts, so the color I used for this month was red on the bottom chart.
Due to climate change we are seeing less blue colors on these Record Scoreboards with time.
As stated, the ranking for July 2020 was 116, which was colored red. I color rankings +10 or -10 from the average ranking of 63 black, indicating that these are near average temperature wise.
We are seeing strong indications that August 2020 will see well above average temperatures for most U.S. states looking at meteorological guidance. It would not surprise me that August 2020 will get ranked as one of the top twenty hottest Augusts in recorded history when climatological data gets processed in early September.
Here is much more detailed U.S. climatology as complied by NOAA:
https://www.ncei.noaa.gov/news/national-climate-202007
Assessing the U.S. Climate in July 2020

Courtesy of Pixabay.com
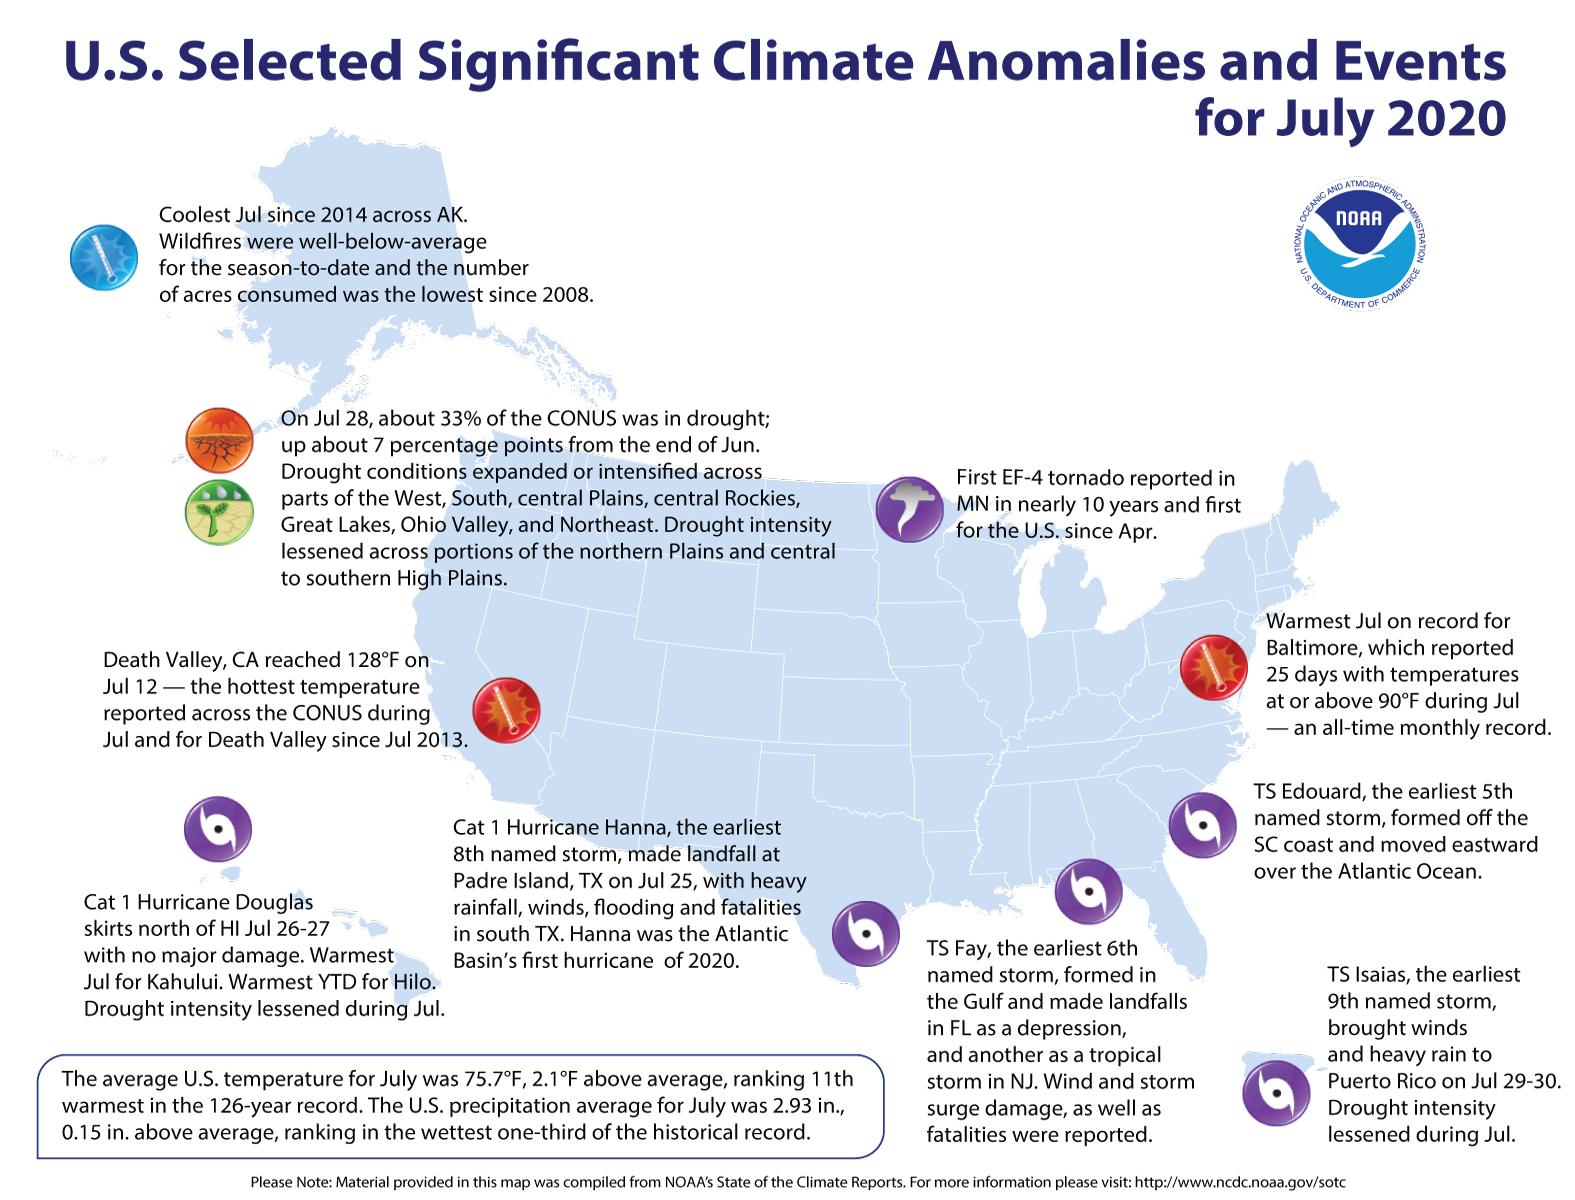
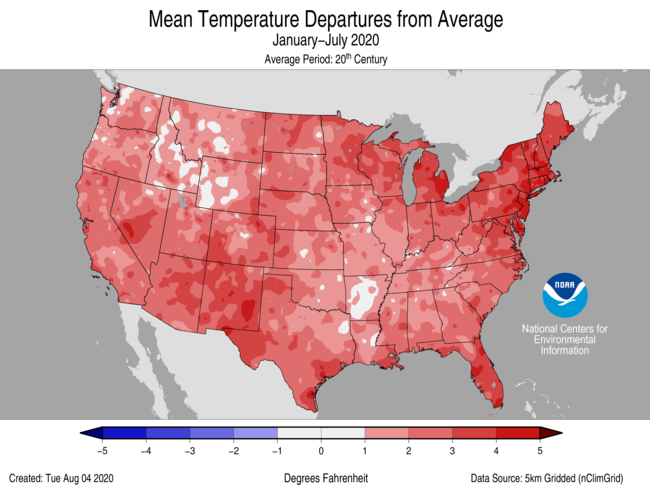
The July 2020 contiguous U.S. temperature was 75.7°F, 2.1°F above the 20th-century average and ranking 11th warmest in the 126-year record. For the year-to-date, the national temperature was 53.6°F, 2.4°F above average, ranking seventh warmest on record.
The July precipitation total for the contiguous U.S. was 2.93 inches, 0.15 inch above average, and ranked in the wettest one-third of the 126-year period of record. The year-to-date precipitation total for the Lower 48 was 19.29 inches, 1.20 inches above average, also ranking in the wettest one-third of the historical record.
This monthly summary from NOAA National Center for Environmental Information is part of the suite of climate services NOAA provides to government, business, academia, and the public to support informed decision-making.

July Temperature
- Above-average July temperatures were present across much of the West, Southwest, central Rockies and from the Mississippi River Valley to the East Coast. Virginia (tied with 2012), Pennsylvania (tied with 1955), Delaware, New Jersey, and Connecticut (all tied with 2013) as well as Maryland and New Hampshire each had their warmest July and month on record with 14 additional states across the South and East having a top-10 month.
- Below-average temperatures were limited to portions of the northern Rockies and central Plains.
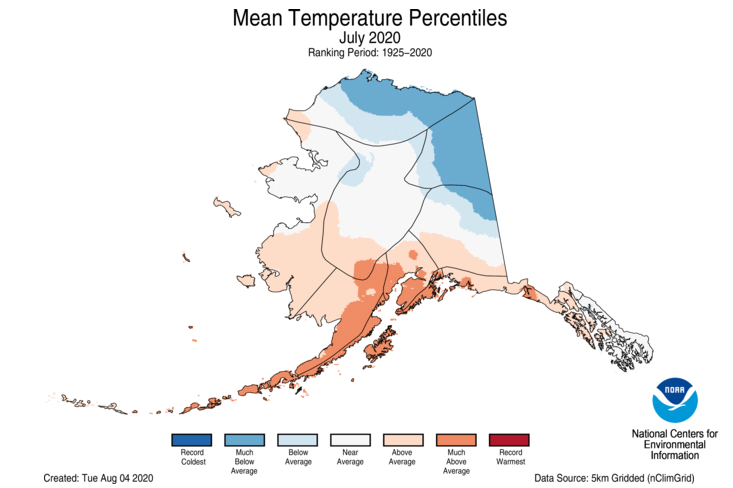
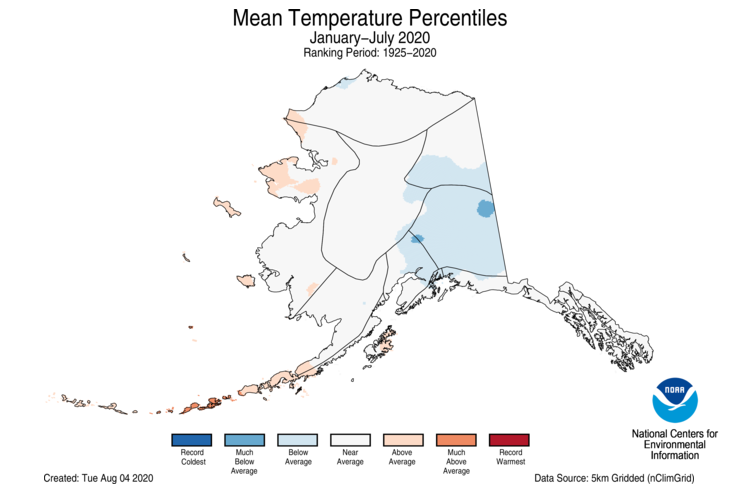
- The Alaska average July temperature was 53.3°F, 0.6°F above the long-term mean and ranked in the middle third of the historical record for the state. It was the coolest July since 2014.
- Much of the northern and eastern portions of the state were cooler than average during July.
- Like much of northern and eastern Alaska, Utqiaġvik (Barrow) had a high temperature for the month of 53°F — the second-lowest July maximum temperature in more than 100 years.
- As a result of the cooler temperatures across the Interior during July and the above-average precipitation during June, the Alaskan wildfire season, to-date, is well-below average and has consumed the lowest number of acres since 2008.
- In contrast to the cooler conditions across the northern and eastern portions of the state, southwestern, south central and portions of southeastern Alaska experienced above-average temperatures during July.
- Kodiak had its third-warmest July since 1915, while Cold Bay tied for fourth warmest (since 1950).
- Sea ice across the Chukchi Sea continues its summertime melt phase with a July average extent at 81% of average — the highest coverage since 2016.

July Precipitation
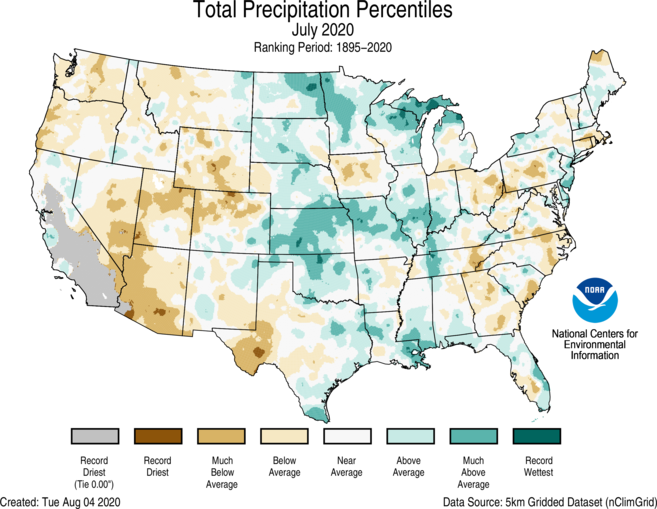
- Above-average precipitation was observed across much of the northern and central Plains as well as the Great Lakes, Mississippi Valley and Gulf Coast. Kansas ranked seventh wettest for July.
- Below-average precipitation fell across much of the West and portions of the Deep South, central Plains, Ohio Valley and Southeast. Arizona ranked sixth driest while Nevada ranked 11th driest.
- The Atlantic Hurricane season has been active with a combination of three tropical storms and two hurricanes named during July. These storms became the earliest fifth, sixth, seventh, eighth and ninth named storms on record in the Atlantic Basin.
- Tropical Storm Edouard formed in the Atlantic Ocean on July 4 off the coast of South Carolina and moved away from land.
- Tropical Storm Fay formed in the Gulf of Mexico on July 9 and, as a depression, proceeded to make landfall over the Florida Panhandle before emerging into the Atlantic Ocean off the Georgia coast, intensifying into a tropical storm and making landfall again near Atlantic City, NJ.
- Tropical storm Gonzalo formed in the eastern Caribbean on July 21 and drifted westward toward the islands of Barbados, St. Vincent and the Grenadines as well as Trinidad and Tobago before dissipating near the Venezuelan coast.
- Hurricane Hanna formed in the Gulf of Mexico on July 23 and tracked westward making landfall on Padre Island, TX as a strong category 1 hurricane. Hanna was the first hurricane of the season in the Atlantic Basin.
- Hurricane Isaias formed in the Caribbean on July 30, bringing heavy winds and rainfall to Puerto Rico before strengthening and moving toward the southeastern U.S.
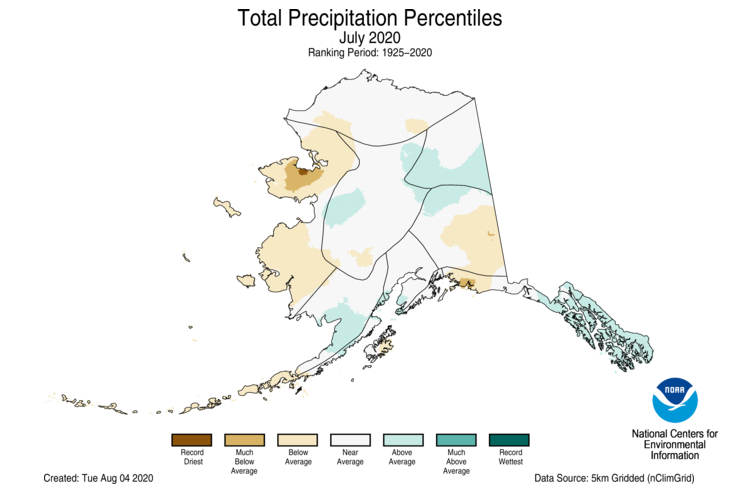
- Alaska received near-average precipitation during July, but regional amounts varied. Much of the West Coast and portions of the Aleutians, Southeast Interior and Northeast Gulf divisions had drier-than-average precipitation while most of the Panhandle and portions of the Northeast Interior, Central Interior and Bristol Bay divisions received above-average precipitation for the month.
- According to the July 28 U.S. Drought Monitor, approximately 33% of the contiguous U.S. was in drought, which is about seven percentage points higher than what was reported at the end of June. Drought conditions expanded or intensified across parts of the West, South, central Plains, central Rockies, Great Lakes, Ohio Valley and Northeast. Drought intensity lessened across portions of the northern Plains and central to southern High Plains. Outside of the contiguous U.S., drought intensity lessened across portions of Puerto Rico, Hawaii and Micronesia.

Year-to-date (January–July) Temperature
- Above- to much-above-average January-July temperatures were observed across much of the Lower 48. Florida had its warmest year-to-date period on record with New Jersey ranking second warmest and Virginia, Maryland, Delaware, Connecticut, Rhode Island and Massachusetts ranking third warmest. The Florida statewide average temperature for the first seven months of 2020 was 72.7°F, 3.3°F above average. Three of the last four years have been the three warmest January-July periods on record.
- Near-average temperatures were concentrated across portions of the northern Rockies and scattered over the northern Plains and the South.
- The Alaska statewide average temperature for this year-to-date period was 26.0°F, 0.2°F above average and ranked in the middle one-third of the record. It was the coolest January-July since 2012. Above-average temperatures were limited to the northwest West Coast division as well as the Aleutians. Below-average conditions were present across much of the Southeast Interior division and portions of the Northeast Interior, Central Interior, Cook Inlet and Northeast Gulf divisions. Near-average temperatures were present across the vast majority of the state.
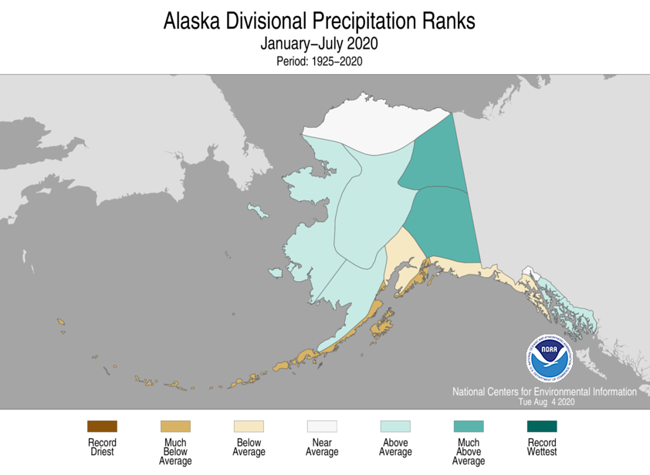
Year-to-date (January–July) Precipitation
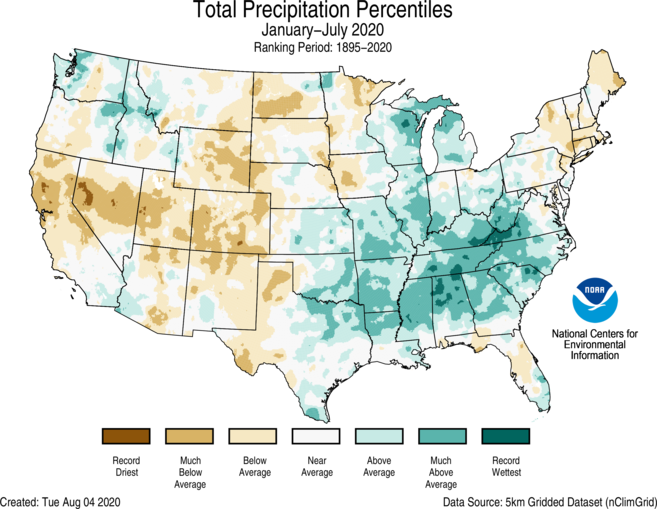
- Above-average precipitation occurred across portions of the Northwest, central Plains and from the Great Lakes to the Gulf Coast and into the Southeast. Tennessee and West Virginia ranked fifth wettest for January-July with an additional five states ranking in the top-10 wettest for this year-to-date period.
- Below-average precipitation was observed from the West Coast to the Rockies, from the northern Plains to southern High Plains, as well as across portions of the Upper Midwest and Northeast. Colorado had its eighth-driest January-July period on record with 8.00 inches of precipitation, 3.17 inches below average.
- Year-to-date precipitation across Alaska ranked at the top of the middle third of the historical record. Much of the Alaskan mainland received above- to much-above-average precipitation over the first seven months of 2020, while the Aleutians, Cooks Inlet and Northeast Gulf regions received below-average precipitation.
For the globe as a whole, according to European Copernicus, July 2020 was the third warmest July in record:
Here is a cold “ET” from the Southern Hemisphere:
Here is more climate and weather news from Thursday:
(As usual, this will be a fluid post in which more information gets added during the day as it crosses my radar, crediting all who have put it on-line. Items will be archived on this site for posterity. In most instances click on the pictures of each tweet to see each article. The most noteworthy items will be listed first.)
Now here are some of today’s articles and notes on the horrid COVID-19 pandemic:
(If you like these posts and my work please contribute via the PayPal widget, which has recently been added to this site. Thanks in advance for any support.)
Guy Walton “The Climate Guy”