Friday January 31st… Dear Diary. The main purpose of this ongoing post will be to track United States extreme or record temperatures related to climate change. Any reports I see of ETs will be listed below the main topic of the day. I’ll refer to extreme or record temperatures as ETs (not extraterrestrials)😉
Main Topic: The “Real” Climate Clock
Dear Diary: These days so many people and organizations have jumped on the climate bandwagon it’s very hard to keep up. Many people, including yours truly, are not aware of what others are doing to prevent our climate from going down the toilet because we are becoming like proverbial needles in a big haystack. Of course, this is not necessarily a bad thing because our sheer numbers should eventually overcome any resistance to policy change through the voting booth. I just hope it won’t be too late.
A few days ago I posted more information on the “Doomsday Clock” suggesting that we should have a “Climate Clock.” I wasn’t aware that somebody else had started this online in 2015 until my Australian associates let me know of its existence yesterday. What I found was a great animation and lots of useful information. Here is the link and info:
“We have been given a very short window of opportunity by the Intergovernmental Panel on Climate Change (IPCC) — that’s why the Climate Clock is so important. The clock is ticking and we need to be reminded of how little time we have left to act.” — David Suzuki
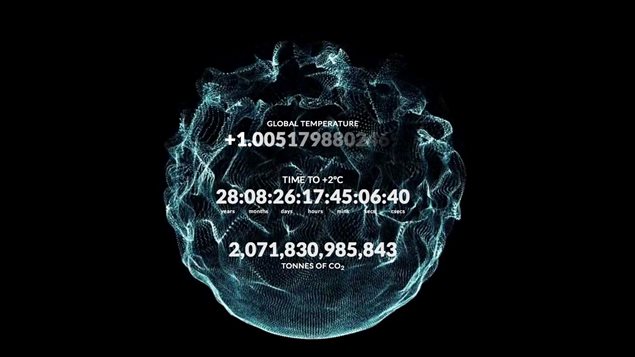
Here is an update on the above graphic:
Global warming to date
+1.1341347974874
Time left to +1.5ºC
12:09:24:17:44:46:32
years months days hours mins secs csecs
2,347,018,797,980
Tonnes of CO2 Emitted
ADDING THE METRIC OF TIME TO THE GLOBAL WARMING CONVERSATION
In signing the Paris Agreement, the world has committed preventing global average temperature from passing the thresholds of 1.5 to 2°C above pre-industrial averages, so as to avoid the most dangerous consequences of global warming. But how far away are these thresholds? And what do we need to do to change direction? The Climate Clock acts a public line in the sand and says, this is the date. It is a measuring stick by which we can evaluate our progress.
The Climate Clock is based on the best available science, and is updated each year to reflect the latest data by a team of leading climate scientists from around the world. Each year, we are able to show how we are doing in relation to 1.5 and 2°C. Have we gained time or lost time?
Humanity has the power to add time to the Clock, but only if we work collectively and measure our progress against defined targets.
THE NUMBERS ON THE CLOCK
The Climate Clock answers the question: given the current rate of emissions and level of human-induced warming, and assuming the emissions trend over the past five years continues into the future, how long will it be before the remaining allowable emissions for 1.5°C are used up?
1) Tonnes of CO2 Emitted
This value shows the total accumulated CO2 emissions from fossil fuel burning, cement manufacture and deforestation since 1870, based on the most recent data from the Global Carbon Project.
2) Global Warming to Date
This number represents the human contribution to observed global temperature increase. This Global Warming Index represents the portion of observed temperature change that can be attributed to all human drivers of climate change. We use 1850-1900 as the reference temperature for the “pre-industrial” period. This is the earliest period for which we have reliable measurements of global temperature, and is the most common reference period for pre-industrial temperatures used in scientific analyses and policy discussions.
3) Time left to 1.5 and 2 °C
The time remaining until +1.5 and +2 °C date is estimated based on extrapolating the most recent 5-year trend of global annual fossil fuel CO2 emissions and calculating the time until we emit the remaining carbon budget – the total allowable emissions for 1.5 and 2°C. Fossil fuel emissions are currently increasing by about 0.1% (or 0.4 billion tonnes) per year and are expected to exceed 37 billion tonnes in 2018. We assume CO2 emissions from deforestation remain constant at current levels. We use best estimates of the remaining carbon budget from the IPCC Special Report on 1.5°C: 770 billion tonnes after 2017 for 1.5°C and 1690 billion tonnes for 2°C. We use the IPCC budget estimates that are based on observational warming estimates to retain consistency with our estimate of global warming to date. These estimates the remaining carbon budget assume a 25% warming contribution from non-CO2 greenhouse gas and aerosol emissions.
CLOCK UPDATE HISTORY
Fifth Update December 12, 2019:
1.5°C date: November 11, 2032
Fourth Update December 5, 2018:
2°C date: August 2, 2052
1.5°C date: December 1, 2034
Third Update November 2017:
2°C date: November 14, 2045
1.5°C date: April 26, 2033
Second Update April 2017:
2°C date: May 25, 2046
1.5°C date: August 25, 2033
First Update April 2016:
2°C date: December 16, 2044
1.5°C date: July 26, 2032
Clock Launch November 2015:
2°C date: December 17, 2043
Rather than add time to the Climate Clock if events such as U.S. elections go well, as I suggested, this clock counts down the time or estimates the time until the globe hits +1.5C then +2.0C above preindustrial conditions. Obviously the clock will slow should emissions somehow be held in check or natural factors like volcanic activity temporarily cool the planet.
I’ll use or point to this useful tool from time to time as we move through this important decade.
Please consider donating through the Paypal widget on this site. I need everyone’s support to continue my work, especially that of processing NCEI record count data for scientific research.
Here is some more weather and climate news from Friday:
(As usual, this will be a fluid post in which more information gets added during the day as it crosses my radar, crediting all who have put it on-line. Items will be archived on this site for posterity.)
(If you like these posts and my work please contribute via the PayPal widget, which has recently been added to this site. Thanks in advance for any support.)
Guy Walton “The Climate Guy”