Saturday August 10th… Dear Diary. The main purpose of this ongoing blog will be to track United States extreme or record temperatures related to climate change. Any reports I see of ETs will be listed below the main topic of the day. I’ll refer to extreme or record temperatures as ETs (not extraterrestrials).😉
Warming Nights Update From Climate Central
Man is this August brutally hot in my hometown of Atlanta and much more than usual. As the old saying goes, it’s not the heat down south, but the humidity that will get you. A warmer airmass can hold more moisture, which is leading to warmer nights. BTW the average low for Atlanta is about 70F this time of the year. The first few days of August the old thermometer has not cracked below 70F:

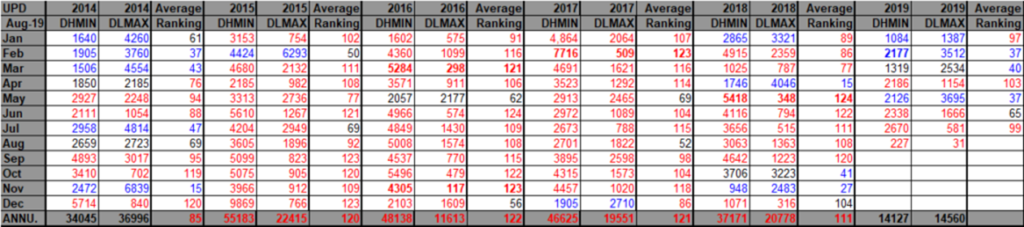
This week Climate Central has written another assessment on the warming trend during nights. We all know now that due to carbon pollution nights are warming foster than days. This trend as I’ve demonstrated is reflected in my own record count analysis across the United States. Not so coincidentally July 2019 saw far more record high minimums than high maximums:


Without further ado, here is what Climate Central posted:
https://www.climatecentral.org/gallery/graphics/how-summer-nights-are-changing-in-your-area
- Published: August 7th, 2019

How Summer Nights are Changing In Your Area
- Published: August 7th, 2019
This summer has been another one for the record books. This June was the hottest June worldwide since records began, and the World Meteorological Organization has said July could be the hottest month on record (NOAA will release its results on August 19th). Daytime extremes from France to India have caught the world’s attention—and multiple attribution studies have connected the recent heat waves to human-caused climate change.
However, overnight low temperatures have been rising even faster than daytime highs. Since 2010, there have been 34% more record high minimums than record high maximums (according to NOAA data compiled by meteorologist Guy Walton). And of all the summers on record, 2018 had the warmest low temperature in the contiguous U.S.
This week, Climate Central examined changes in average summer low temperatures around the country. Since 1970, 93% of the cities analyzed have experienced an increase. Reno and Las Vegas, Nevada, topped the list with temperature increases of 16.9°F and 9.1°F respectively, followed by El Paso, Texas at 7.7°F and Salt Lake City, Utah at 6.6°F. Eight of the ten fastest warming cities were west of the Mississippi. Nationally, the increase was 1.8°F since 1895, dating back to when records began. (Click on the widget below for your nearest city.)
Local: trend for average temp of summer nights
Warm nights carry major health risks. When the temperature doesn’t drop much overnight, it doesn’t give people a chance to recover from extreme daytime heat, especially in regions that are unaccustomed to such extremes. Urban areas can retain even more heat through their dense network of concrete roads and buildings, making nighttime temperatures up to 22°F higher than in rural areas.
Health risks are higher for vulnerable populations such as the sick, elderly, and lower-income communities who may not have air conditioning or struggle to access cooling centers.
And even for those who have AC, the cost is only increasing as the climate warms. A 2018 Climate Central report noted that 93% of the same cities analyzed have observed a rise in cooling degree days (which relates to how much we use our AC units). Cooling off by using fans with ice tanks—as well as trees and other green infrastructure—can help reduce these energy costs and health risks.
METHODOLOGY: The trend in summer minimum temperatures (June, July, August) was computed using data from the Applied Climate Information System and applying a mathematical linear regression. The national graphic used contiguous U.S. data from NOAA/NCEI Climate at a Glance.
Climate Central’s local analyses include 244 stations. However, for data summaries based on linear trends, only 242 stations are included due to large data gaps in St. Johnsbury, Vermont and Wheeling, West Virginia.
Posted in Trends, Climate, Extremes, Heat, Climate Statistics, United States
I thank Climate Central for continuing to have interest in my work.
Here is some related material:
Here is more climate and weather news from Saturday:
(As usual, this will be a fluid post in which more information gets added during the day as it crosses my radar, crediting all who have put it on-line. Items will be archived on this site for posterity. In most instances click on the pictures of each tweet to see each article.)
(If you like these posts and my work please contribute via the PayPal widget, which has recently been added to this site. Thanks in advance for any support.)
Guy Walton- “The Climate Guy”