Friday May 10th … Dear Diary. The main purpose of this ongoing blog will be to track United States extreme or record temperatures related to climate change. Any reports I see of ETs will be listed below the main topic of the day. I’ll refer to extreme or record temperatures as ETs (not extraterrestrials).😉
More U.S. Wet Statistics And Gulf Coastal Flooding
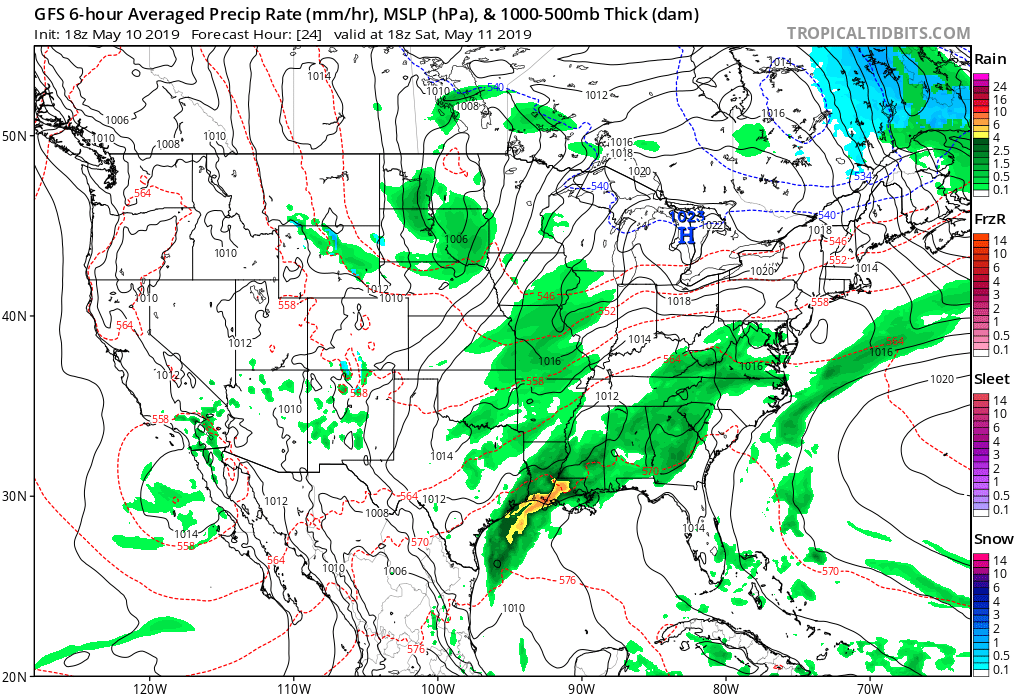
It seems like every week for the past year I have pointed out at least one statistic or reported on major flooding somewhere in the United States. A few days ago I noted that the synoptic pattern for this week would perhaps lead to severe storms and flooding in the central United States:
Thankfully, there wasn’t enough instability and dynamics for a tornado outbreak. A very slow moving front, though, has produced widespread flooding across the central Gulf Coastal area with a bullseye on Houston.
This decade Houston has had horrible flooding culminating with what happened in association with Harvey. This week Houston has had about 6 to 12″ of rain making some residents scratch their heads thinking that this wet regime is the new normal. Certainly with the advent of a weak El Nino combining with climate change it would appear that way.
Our friends from Weather Underground have already written a strong piece on more U.S. wet statistics:
Quoting Weather Underground from the 8th:
The 12 months ending in April 2019 were the wettest year-long period in U.S. records going back to 1895, according to the monthly U.S. climate summary issued Wednesday by the NOAA National Centers for Environmental Information. Averaged across the contiguous U.S., the total of 36.20” made the period from May 2018 to April 2019 the first year-long span ever to top 36”. The old record for any 12-month period was 35.78”, from April 2015 to March 2016.
Given the fierce drought-related impacts of the 2010s—including multiple deadly wildfire disasters from Tennessee to California—it may seem a bit counterintuitive that the nation has actually been getting wetter overall. Across the contiguous U.S., average yearly precipitation has risen by about 2” over the past century, from around 29” to just over 31” (see Figure 1). For the entire nation, including Alaska and Hawaii, precipitation increased by about 4% in the period from 1901 to 2015, according to the U.S. National Assessment.

Figure 1. Annual precipitation across the contiguous U.S. has increased by about 7% over the past century. Blue bar shows the linear increase since 1895, while the red curve is a smoothed version of the year-to-year numbers in green. When averaged over running four-year periods (not shown), the past four years are the wettest on record for the contiguous U.S. Image credit: NOAA/NCEI. |
A few soggy periods dominate the wettest U.S. years on record
The ten wettest 12-month spans in the contiguous U.S. (see below) are clustered around several periods when major events pushed the numbers up in a big way. Over the past year, we’ve had Hurricane Florence in the Southeast, as well as a remarkably soggy autumn in the Midwest and the nation’s wettest winter on record. In 2015-16, we saw the wettest months on record in both Texas and Oklahoma (May 2015) and the Southeast flooding related to offshore Hurricane Joaquin (October 2015).
The top-ten list also reflects the impact of the major El Niño of 1972-73 and the wet Midwest winter and spring that followed, culminating in large-scale snowmelt and massive flooding along the Missouri and Mississippi River. The El Niño of 1982-83, the strongest on record at the time, also enters into the list, and it’s worth noting that a comparably strong El Niño was in play during 2015-16.
The Ten Wettest 12-Month Periods in Contiguous U.S. History
36.20” May 2018–Apr. 2019
35.95” May 2015–Apr. 2016
35.78” Apr. 2015–Mar. 2016
35.73” Mar. 2018–Feb. 2019
35.63” Feb. 1973–Jan. 1974
35.49” Apr. 2018–Mar. 2019
35.47” Jun. 1982–May 1983
35.42” May 1982–Apr. 1983
35.35” Mar. 1973–Feb. 1974
35.33” Feb. 2018–Jan. 2019
Please read the entire article for more:
https://www.wunderground.com/cat6/Wettest-12-Months-US-History
And from the Weather Channel:
In the long term yet another Gulf Coast major city is in dire jeopardy:
In the short term here is what we saw just today in and around the Houston area:
Well, you get the picture.😉
On the bright side of all this news drought has just about been eliminated from the lower 48 states:
Houston and the Gulf Coast won’t dry out until Monday due to a stationary front over the area:
I’ll be adding more to this post as I get more information on the current round of flooding through this weekend.
………………………………………………………………………………………………….
Here is more climate and weather news from Friday:
(As usual, this will be a fluid post in which more information gets added during the day as it crosses my radar, crediting all who have put it on-line. Items will be archived on this site for posterity. In most instances click on the pictures of each tweet to see each article.)
(If you like these posts and my work please contribute via the PayPal widget, which has recently been added to this site. Thanks in advance for any support.)
Guy Walton- “The Climate Guy”