Meehl/Tebaldi/Walton Record Study Gets More Scrutiny
Wednesday March 20th… Dear Diary. The main purpose of this ongoing post will be to track United States extreme or record temperatures related to climate change. Any reports I see of ETs will be listed below the main topic of the day. I’ll refer to extreme or record temperatures as ETs (not extraterrestrials).😉
When one is involved in a field of science it’s both thrilling and gratifying to actually complete a peer reviewed research paper published after a lot of hard work. Not all scientists attain such an achievement, particularly ones without a doctorate, so I was very humbled to be part of such a knowledgeable team. Essentially the biggest finding published in 2009 was that there was a 2 to 1 ratio of record daily high maximum temperatures to lows.
The study also began to focus on how extreme temperatures associated with weather, both cold and hot, will behave in a warming world due to carbon pollution. We know that the chances for seeing record heat is now twice that of record cold at about +1.0C above preindustrial conditions, which is the current temperature departure from 19th century averages planet wide. We are now trying to determine ratios at +2.0C and, God forbid, +3.0C and up. This is important in association with the realm of determining how much of the planet might be uninhabitable, particularly If we cross that all important +2.0C threshold.
The authored by Dr. Gerald Meehl study, which I initiated on 1/1/2000 painstakingly cataloging record counts, took nearly a decade to complete, being published in 2009. It’s been a decade since then, so many others have duplicated the study using stations with similar periods in which temperature data was processed. In science even peer reviewed material must undergo the scrutiny of others in time to cement findings. One such group, this time from the Associated Press, just completed and published an in depth study, again determining that across the United States record highs are being set at twice the rate of record lows. Check this out:
https://apnews.com/7d00e38b9ba1470fa526b1da739c5da8
Here is a repost of this AP article:
Heat records falling twice as often as cold ones, AP finds
By SETH BORENSTEIN and NICKY FORSTER
Over the past 20 years, Americans have been twice as likely to sweat through record-breaking heat rather than shiver through record-setting cold, a new Associated Press data analysis shows.
The AP looked at 424 weather stations throughout the Lower 48 states that had consistent temperature records since 1920 and counted how many times daily hot temperature records were tied or broken and how many daily cold records were set. In a stable climate, the numbers should be roughly equal.
Since 1999, the ratio has been two warm records set or broken for every cold one. In 16 of the last 20 years, there have been more daily high temperature records than low.
The AP shared the data analysis with several climate and data scientists, who all said the conclusion was correct, consistent with scientific peer-reviewed literature and showed a clear sign of human-caused climate change. They pointed out that trends over decades are more robust than over single years.
The analysis stopped with data through 2018. However, the first two months of 2019 are showing twice as many cold records than hot ones. That’s temporary and trends are over years and decades, not months, said National Oceanic and Atmospheric Administration climate monitoring chief Deke Arndt.
“We are in a period of sustained and significant warming and — over the long run — will continue to explore and break the warm end of the spectrum much more than the cold end,” Arndt said.
Former Weather Channel meteorologist Guy Walton, who has been studying hot and cold extreme records since 2000, said the trend is unmistakable.
“You are getting more extremes,” Walton said. “Your chances for getting more dangerous extremes are going up with time.”
No place has seen the trend more clearly than the Southern California city of Pasadena, where 7,203 days (more than 19 years) went by between cold records being broken. On Feb. 23, Pasadena set a low temperature record, its first since June 5, 1999.
Vermont native Paul Wennberg felt it. He moved to Pasadena in 1998 just before the dearth of cold records.
“Even with the local cold we had this past month, it’s very noticeable,” said Wennberg, a California Institute of Technology atmospheric sciences professor. “It’s just been ever warmer.”
In between the two cold record days, Pasadena set 145 hot records. That includes an all-time high of 113 degrees last year.
“Last year was unbelievable here,” Wennberg said. “The tops of a lot of the hedges, they essentially melted.”
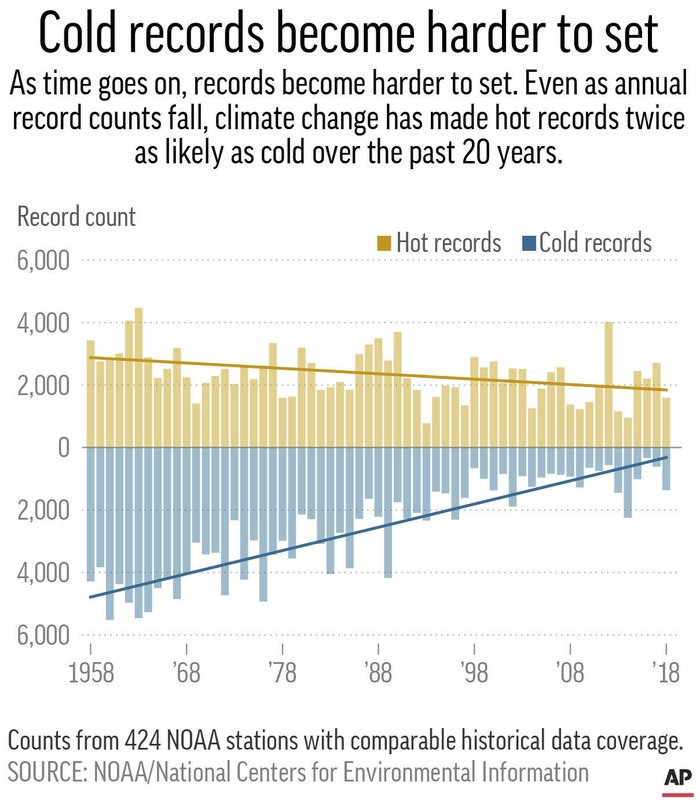
Chart shows annual counts from 1958 to 2018 for high maximum and low minimum temperature records across 424 AP-selected NOAA GHCN Daily weather stations. (AP graphic/Nick Forster)
Scientists often talked about human-caused global warming in terms of average temperatures, but that’s not what costs money or sends people to the hospital. A study this month found that in just 22 states, about 36,000 people on average go to the hospital because of excessive summertime heat.
“The extremes affect our lives,” Arndt said, adding that they are expensive, with hospital stays, rising energy bills and crop losses.
National Center for Atmospheric Research climate scientist Gerald Meehl, who has published peer-reviewed papers on the rising hot-to-cold ratio, said people pay more attention to climate when records are broken.
The AP counted daily records across 424 stations starting in 1920 and ending in 2018. The AP only considered daily — not all-time — high maximum temperatures and low minimum temperatures and only used stations with minimal missing data. Temperatures that tied previous records were counted in addition to temperatures that broke previous records.
More typical than Pasadena is Wooster, Ohio. From 1999 on, Wooster saw 106 high temperature records set or broken and 51 cold ones. In the previous eight decades, the ratio was slightly colder than one to one.
At MW Robinson Co., people are lining up for air conditioning installation as the climate seems to get have been getting hotter over the years, said Lori Bowersock, who coordinates the firm’s HVAC installations.
“It’s more and more every year,” Bowersock said. “Usually we don’t have them lined up like this.”
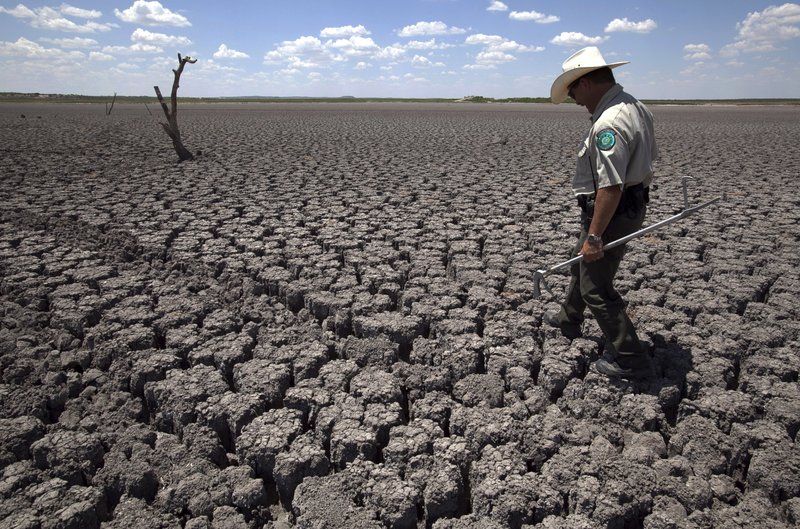
Texas State Park police officer Thomas Bigham walks across the cracked lake bed of O.C. Fisher Lake, in San Angelo, Texas, on Aug. 3, 2011. (AP Photo/Tony Gutierrez, File)
The AP’s other findings:
— Since Jan. 1, 1999, just under half the stations had at least twice as many hot records set than cold ones, including Wooster.
— In all, 87 percent of the weather stations had more hot records than cold since 1999. There have been 42 weather stations that have at least five hot records for every cold one since 1999, with 11 where the hot-to-cold ratio is 10-to-1 or higher, including Pasadena.
— All nine of NOAA’s climate regions have seen more hot records set than cold ones since 1999, with the West, Southwest and Northeast having a 3-to-1 ratio.
— All four seasons have had more hot records broken than cold for the same time period.
— Most decades in the 20th century had close to an even ratio of hot to cold. The 1930s, driven by Dust Bowl summers, had about 1.4 hot records for every cold. The 1960s and 1970s had about 1.5 cold records for every hot. The 21st century has a 1.9-to-1 hot-to-cold ratio.
“As a measure of climate change, the dailies (temperature records) will tell you more about what’s happening,” said climate scientist Chris Field of Stanford. “The impacts of climate change almost always come packaged in extremes.”
___
Borenstein, an AP science writer, reported from Washington. Forster, an AP data journalist, reported from New York. Follow Seth Borenstein on Twitter at @borenbears .
___
The Associated Press Health and Science Department receives support from the Howard Hughes Medical Institute’s Department of Science Education. The AP is solely responsible for all content.
Here is an initial graphic from the 2009 Records Study, which predicted what the AP graph would be shaped like currently and beyond:
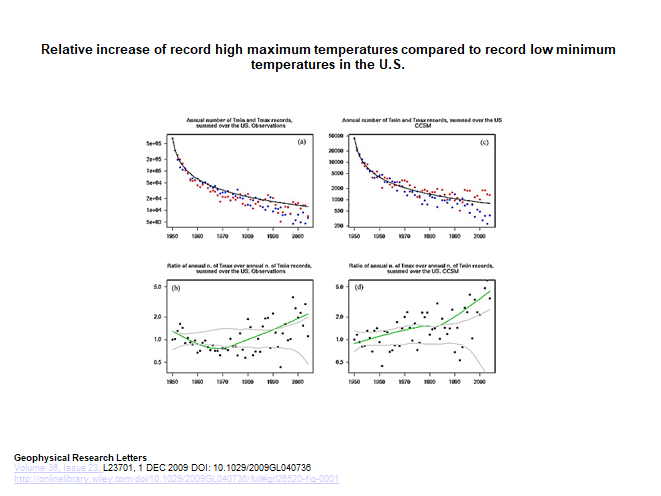
By 2019 we are finding that the number of occurrences of record lows are decreasing with those of record maximums holding about steady as predicted in 2009. Any climate change deniers should give pause here in the face of a scientific study and forecast that is verifying.
My datasets involve all or the “kitchen sink” of record reports contained within the NCEI database unlike the more refined station data scrutinized by the AP. Since 1920 we see the following statistical chart, which is literally compiled from hundreds of thousands of individual reports:
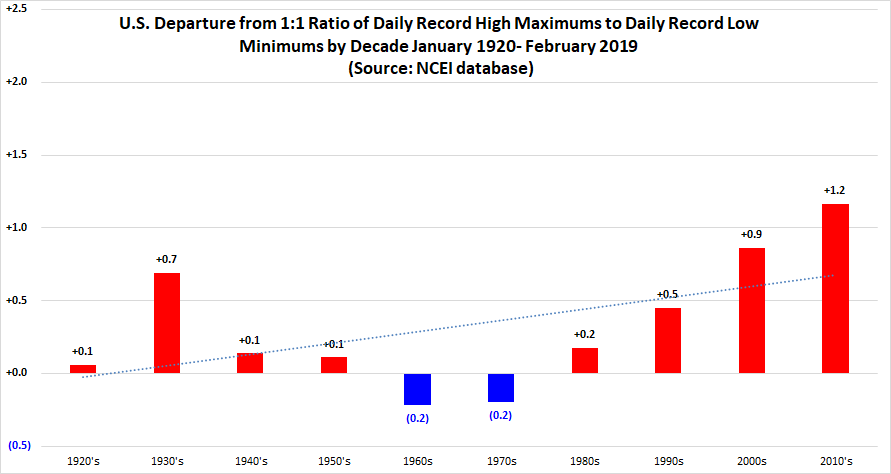
I’ve found that the ratio of record daily maximums to minimums is slightly below 2-1 for the 2000s and above for the 2010s. We have defiantly seen a big warming trend since 1980 despite numerous frigid, life threatening cold waves. Extremes in temperatures continue to occur, just not as many cold as predicted by the study. Record heat will be a big problem in the future, which cannot be denied.
……………………………………………………………………………..
Here is more climate and record data from Wednesday:
(As usual, this will be a fluid post in which more information gets added during the day as it crosses my radar, crediting all who have put it on-line. Items will be archived on this site for posterity. In most instances click on the pictures of each tweet to see each article.)
Here are some of Wednesday’s ET reports:
(If you like these posts and my work please contribute via the PayPal widget, which has recently been added to this site. Thanks in advance for any support.)
Guy Walton- “The Climate Guy”