Wednesday July 11th… Dear Diary. The main purpose of this ongoing post will be to track United States extreme or record temperatures related to climate change. Any reports I see of ETs will be listed below the main topic of the day. I’ll refer to extreme or record temperatures as ETs (not extraterrestrials)😊. Here is today’s main climate change post related hot topic:
High Cost of Heat
This morning I learned that Climate Central has completed an in depth analysis of the added cost of higher heat produced by carbon pollution. The results aren’t surprising, but the sticker shock needs to be conveyed on this platform, which main purpose is letting all know how skewed extreme heat has become as opposed to record chill. So, today Climate Central has this site’s floor. Here is their PDF by Jen Brady on the added cost of carbon pollution related heat:
http://assets.climatecentral.org/pdfs/June2018_CMN_Heat.pdf
Since this article is very prescient in association with mid summer heat I am reprinting Jen’s work in its entirety:
Report: The High Cost of Hot
As additional carbon pollution continues to trap more and more heat in the atmosphere, the higher temperatures that result can come with a hefty price tag. Some of those costs hit our wallets in the form of higher energy bills from greater use of air conditioning. Warmer temperatures can also have major health impacts, increasing our vulnerabilities to allergies, asthma, heat stroke and even death. To better understand how this is impacting local communities, Climate Central analyzed trends in cooling degree days and minimum temperatures. Of the 244 cities analyzed, 93 percent had an increase in cooling degree days. Much of this warming occurs at night, demonstrated by the fact that of those same cities, 87 percent see an increase in the occurrence of overnight low temperatures above a threshold of either 55°F or 65°F.
Warm Nights
According to the National Sleep Foundation, the optimal temperature for sleeping is around 65°F. Unfortunately, daily minimum temperatures, which most often occur at night when our bodies rest and recover, have been increasing as a result of climate change. And in many places, those minimums have been increasing at a faster rate than the average temperature. The jump in overnight lows is driving much of the overall temperature increase in the United States. According to calculations by NOAA/NCEI, the rate of warming for overnight temperatures since 1900 is more than 20 percent higher than the daytime rate.

Climate Central analyzed the trend in nights above 65°F for cities across the country. For a smaller set of cities that rarely experience nights above 65°F, we dropped that temperature to 55°F for this analysis. Overall, our analysis found that 87 percent of U.S. cities are experiencing more warm nights since 1970. El Paso, Las Cruces, and Fresno all see an increase of more than 50 nights over 65°F, while San Francisco had the biggest increase of 80 nights over 55°F.

Urban Heat Islands

Because surfaces like streets and buildings absorb the sun’s heat more readily than do trees and grasses, cities typically become “urban heat islands”. Researchers have estimated that the urban heat island effect can increase overnight temperatures in cities by as much as 22°F. And while the temperature on the thermometer in rural areas may not be quite as high as the cities, the long-term trend is the same — temperatures are rising. So cities alone are not driving the overall rising temperatures nationally and globally.
Adding vegetation in cities can help lessen the heat island effect. Researchers estimate that shaded surfaces can be a remarkable 20–45°F cooler than the peak temperatures of unshaded materials— which means lower air-conditioning costs and relief for those working in the heat. However, a recent analysis found that many urban areas in multiple states are losing tree cover, sometimes dramatically so. For example, between 2009 and 2014, Rhode Island and Georgia respectively lost 44 and 40 percent of their urban and community tree cover.
Cooling Degree Days
The concept of cooling degree days (CDD), and their counterpart heating degree days (HDD), are primarily used to estimate the amount of artificial cooling or heating needed to maintain a comfortable indoor temperature.
In fact, degree days aren’t actually days at all. They represent the number of degrees the daily average temperature is above or below 65°F. In this report, we are focusing on heat and the corresponding cooling degree days, which follow this equation:

It’s important to note, an increase in the number of cooling degree days is a result of an increase in the number of days above 65°F, an increase in the number of degrees above 65°F, or both.
Climate Central analyzed 244 cities in the U.S. and determined that 93 percent have seen an increase in CDDs. Traditionally hot cities have seen the highest rise in CDDs. The largest increases are in McAllen, Texas, Phoenix and Las Vegas. However, many cooler cities that in the 1970s did not need widespread air conditioning are experiencing a large percentage increase in the past 10 years. For example, the number of CDDs in San Francisco and Portland, OR have almost doubled during the analysis period. Here is an example from Phoenix:

This Climate Central report has a nice widget allowing viewers to see other city’s energy demand trends:
Here is one for my home town Atlanta:

As temperatures continue to climb, so will the cost of associated electricity bills and the demand for air conditioning our homes and places of business increases. Air conditioning is already the largest share of residential electricity use (17 percent), according to the Energy Information Administration. In 2015, Americans spent over $27 billion cooling their homes.
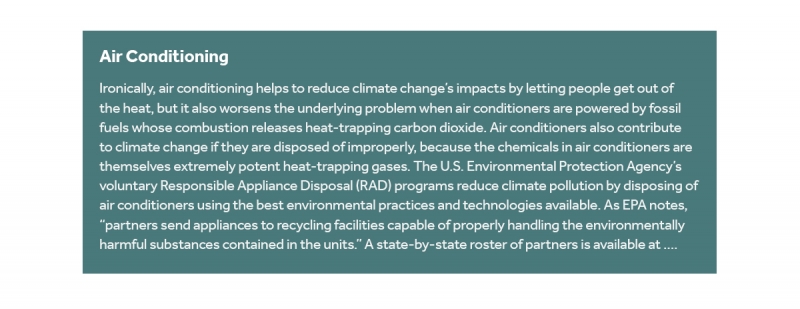
A state-by-state-roster of partners is available on the EPA’s website.
Households in Texas, Oklahoma, Arkansas and Louisiana have the highest air conditioning use per household — almost six times more than in New England. The average annual cost for homes across the U.S. with air conditioning is approximately $250. In the high use areas of the South, air conditioning costs are almost $450 a year. A 2014 Climate Central analysis of projected future summer temperatures shows that by 2100 New England summers will be as hot as current summers in Florida, dramatically increasing the need for artificial cooling.

Methodology: Trends in minimum temperatures and cooling degree days were calculated using data from the Applied Climate Information System (rcc-acis.org). Both analyses excluded years with more than 60 days of missing data. For the analysis of days with a minimum temperature at or above 65°F (or 55°F for a smaller subset), we counted the total number of days with a minimum temperature each year at or above that threshold. Cooling degree days were calculated using the sum of the daily cooling degree days measure. All analyses were performed in R. Trends were estimated using R’s simple linear regression model.
Climate Central’s Jennifer Brady contributed data analysis for this story.
………………………………………………………………………
In other news our low grade heat wave in the Plains will last another day looking at model forecast max temps for Thursday:
Conditions will get pretty toasty, as well, from California into the Pacific Northwest.
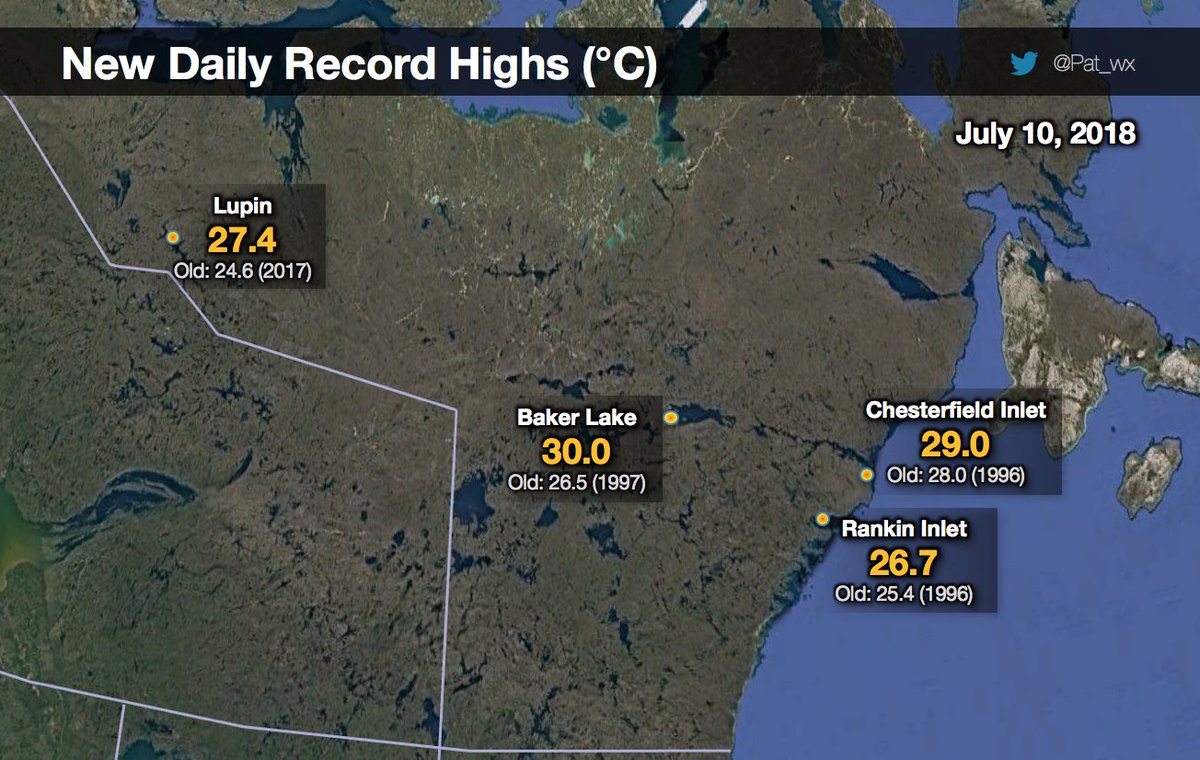
It’s very toasty in portions of Canada:

As usual, I will be adding relevant news items to this post as they cross my radar later today.
(If you like these posts and my work please contribute via the PayPal widget, which has recently been added to this site. Thanks in advance for any support.)
The Climate Guy