Sunday February 4th… Dear Diary. The main purpose of this ongoing post will be to track United States extreme or record temperatures related to climate change. Any reports I see of ETs will be listed below the main topic of the day. I’ll refer to extreme temperatures as ETs (not extraterrestrials)😊. Here is today’s climate change related topic:
Icy Check Up
It’s been a while since I’ve presented sea ice data, so without further adoo let’s see how it’s doing at both poles. In particular these days I like turning to cryosphere expert Zack Labe for presentation of data sets.
Here is what we currently have around Antarctica during the near peak of southern hemisphere summer:
Zack LabeVerified account @ZLabe Following Following @ZLabe
Checking in with the other pole, #Antarctic sea ice is also nearly surpassing last year’s record low extent…

Annual minimum is within a few weeks or so. Daily data is from @NSIDC. Additional plot: http://sites.uci.edu/zlabe/antarctic-sea-ice-extentconcentration/ …
9:28 AM – 4 Feb 2018
And in the Northern Hemisphere:
No surprises here: average January (2018) #Arctic sea ice extent was the lowest in the satellite record…
Data from @NSIDC at https://t.co/aUqFYmnK0c pic.twitter.com/FZEqtxR34S
— Zack Labe (@ZLabe) February 2, 2018
As far as Arctic ice thickness goes here is Zack’s latest animated data:
A look at the loss of thicker (usually older) #Arctic sea ice in Octobers from 1979-2016 (PIOMAS, ice < 1.5 meters masked black) pic.twitter.com/BtHCwVUdKk
— Zack Labe (@ZLabe) November 14, 2016
So our brief, quick sea ice check up is pretty bad…like a dentist seeing a mouth full of cavities only this time it’s the environment that’s in for a world of hurt. The vicious cycle of record atmospheric warmth from carbon pollution, as has been predicted for decades, is leading to record low sea ice extent at both poles, which in turn is increasing low albedo, which increases atmospheric warmth. This is not good:
 Zack LabeVerified account @ZLabe
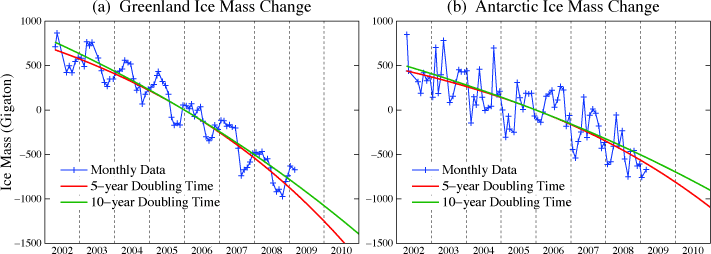
The other shoe to drop, although thankfully not yet, is when Antarctica’s massive land ice starts to give way and melts at a more rapid pace leading to much faster rates of sea level rise. This data set isn’t looking very good either:
https://climate.nasa.gov/vital-signs/land-ice/
ANTARCTICA MASS VARIATION SINCE 2002
Credit: NASA

For more on where sea ice research is headed see this detailed new post by Bob Henson: https://www.wunderground.com/cat6/models-coming-agreement-widespread-effects-arctic-sea-ice-loss
Which leads us to this article about Trump’s comments: https://www.truthdig.com/articles/no-ice-isnt-growing-poles-yes-boiling-earth/
Quoting from the article and using two more datasets:
Anyway, the paid-for denialists that Trump has been listening to have deliberately buried the lede. The story isn’t a little bit of extra sea ice around the continent of Antarctica. The story is the melting of the Antarctic ice pack. And that is not in doubt, any more than the melting of the Greenland ice pack.
It includes enormous glaciers that are held back by ice shelves that extend over the ocean. If the ice shelves plop in, that won’t matter much–they are already in the water and so won’t increase sea level if they fall in. But if they release the glaciers, and the glaciers fall into the ocean, that will matter quite a lot. One of those glaciers is so enormous that it could raise sea level several yards/ meters all by itself, in which case say bye bye to Mar-a-Lago and Miami and New Orleans and Calcutta, etc.
O.K. Time to drop the mic here. This icy checkup gets an F at the start of 2018. Enough said.
………………………………………………………………………
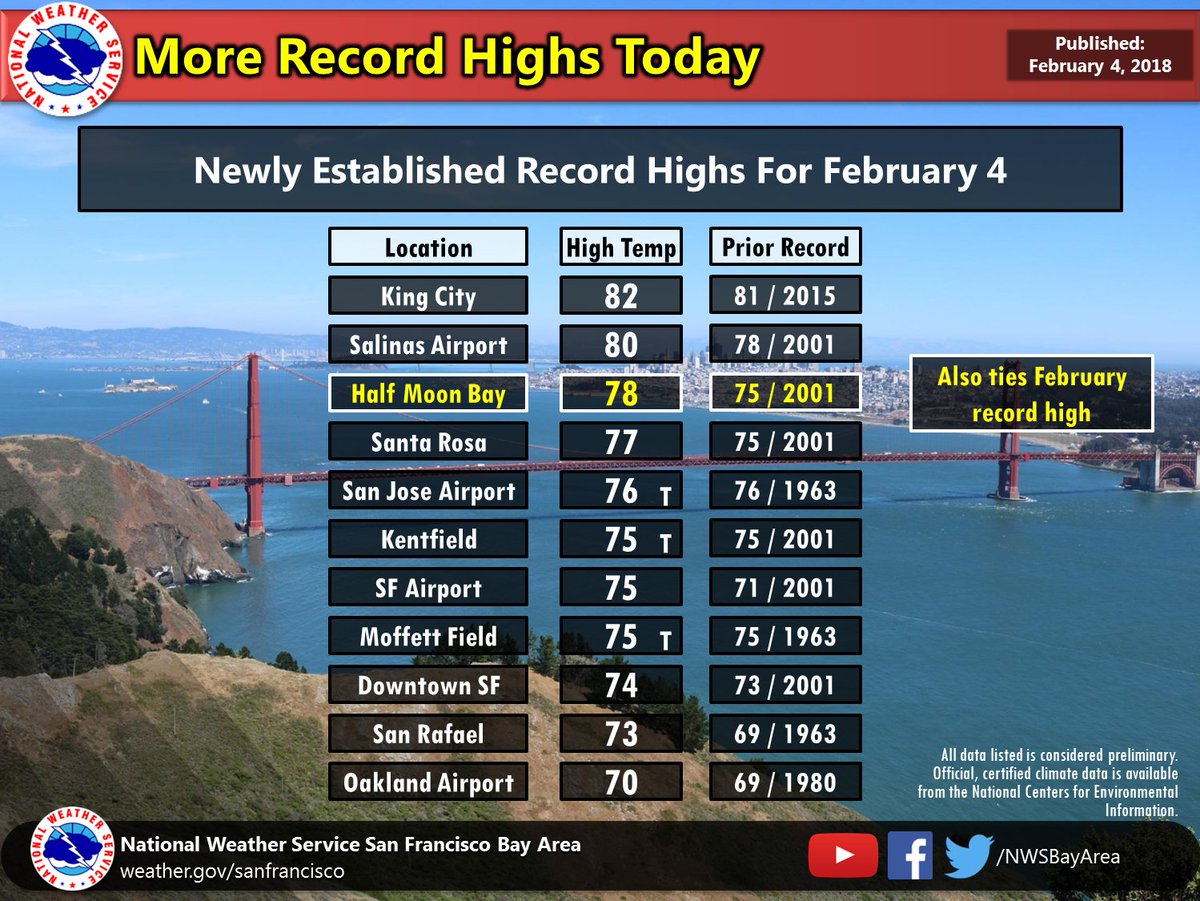
Here are some reports of records (ETs) for 2/4/18:


11 daily record highs broken or tied throughout the San Francisco Bay Area & central CA coast this afternoon. Additionally, Half Moon Bay tied their February record high. #CAwx #climate
The Climate Guy