Thursday January 18th… Dear Diary. The main purpose of this ongoing post will be to track United States extreme or record temperatures related to climate change. I’ll refer to extreme temperatures as ETs (not extraterrestrials)😊. Here is today’s climate change related topic:
Global Averages of 2017… More Ebbs and Flows
Last January I wrote my third post on this site entitled “Ebbs and Flows.” The Ebbs and Flows I am referring to are the subtle ups and downs from year to year on climate charts:
https://guyonclimate.com/2017/01/26/climate-ebbs-and-flows/
Here is what I stated in association with 2016 global averages:
“For the first time since global temperature averages have been kept there have been three years in a row of record warmth. The forecast for 2017 is to be slightly below that of 2016, but why? If 2017 were to see another record it would be the fourth year in a row of an upward spike for this graph. Going back to my last post I noted that the planet is coming off a “strong” El Nino. The strong El Nino is the main culprit for the spike on the chart in figure 1 in 2016. It usually takes the warming effects of El Nino a few months to wane after the event has ended for global averages to cool.”
Here was last year’s Figure 1:

Figure 1. (Credit Bob Henson and Jeff Masters from their Weather Underground blog) Quoting their blog, “The U.K. Met Office predicts that the 2017 global temperature (forecast range shown in green at right) will likely fall below the record value expected to be set in 2016. The dark line shows global temperature since 1850 as calculated by an average of analyses by the Met Office/Hadley Centre, NASA, and NOAA. Each of the three agencies uses slightly different techniques to account for sparsely populated regions, such as the poles. These differences have very little effect on the year-to-year trends, which are in very close agreement for all three analyses. The shaded band shows the 95% uncertainty range for each annual data point. Image credit: U.K. Met Office.”
Voila. 2017 global averages were processed and finalized today, and the forecast from a year ago was correct…a slight cooling from 2016, but a top 3 finish:

Figure 2. Departure from the 20th-century average for the global January-through-December temperature for the years 1880 – 2017. Last year saw the third warmest temperatures on record. Image credit: NOAA/National Centers for Environmental Information (NCEI).
We also saw a transition to La Nina during 2017, which was characterized as a La Nina year. Since we see La Nina year global averages below that of El Nino or neutral years, it’s remarkable that 2017 was the warmest La Nina year on record. I like this chart showing how monthly averages behave during ENSO cycles:

Figure 3. Monthly departures from 20th-century average temperature for the period 1980 through 2017, colored to indicate whether an El Niño (red) or La Niña (blue) event was under way. Gray bars indicate neutral months. The year 2017 saw the highest monthly departures from average on record for any neutral and La Nina months, as well as the highest annual temperatures for any year without an El Niño event. Image credit: NOAA/NCEI.
How did renowned NASA climate scientist Gavin Schmidt do with the 2017 prediction?
Gavin SchmidtVerified account @ClimateOfGavin

So, what would I anticipate for 2018? La Nina should weaken by spring or summer transitioning to neutral conditions. Barring stronger volcanic activity the global warming trend will also continue, so 2018 averages should be at or slightly higher than those of 2017, but probably below those of the strong El Nino year 2016.
Here is how 2017 stacks up with the last three years:
 Assaad RazzoukVerified account @AssaadRazzouk
1 2016
2 2017
3 2015
And If That Weren’t Enough, 17 of the 18 Warmest Years On Record Have All Been During this Century, With Degree of Warming During Past 3 Years “Exceptional”
Here are the top ten warmest years on record after the 2017 data was processed:
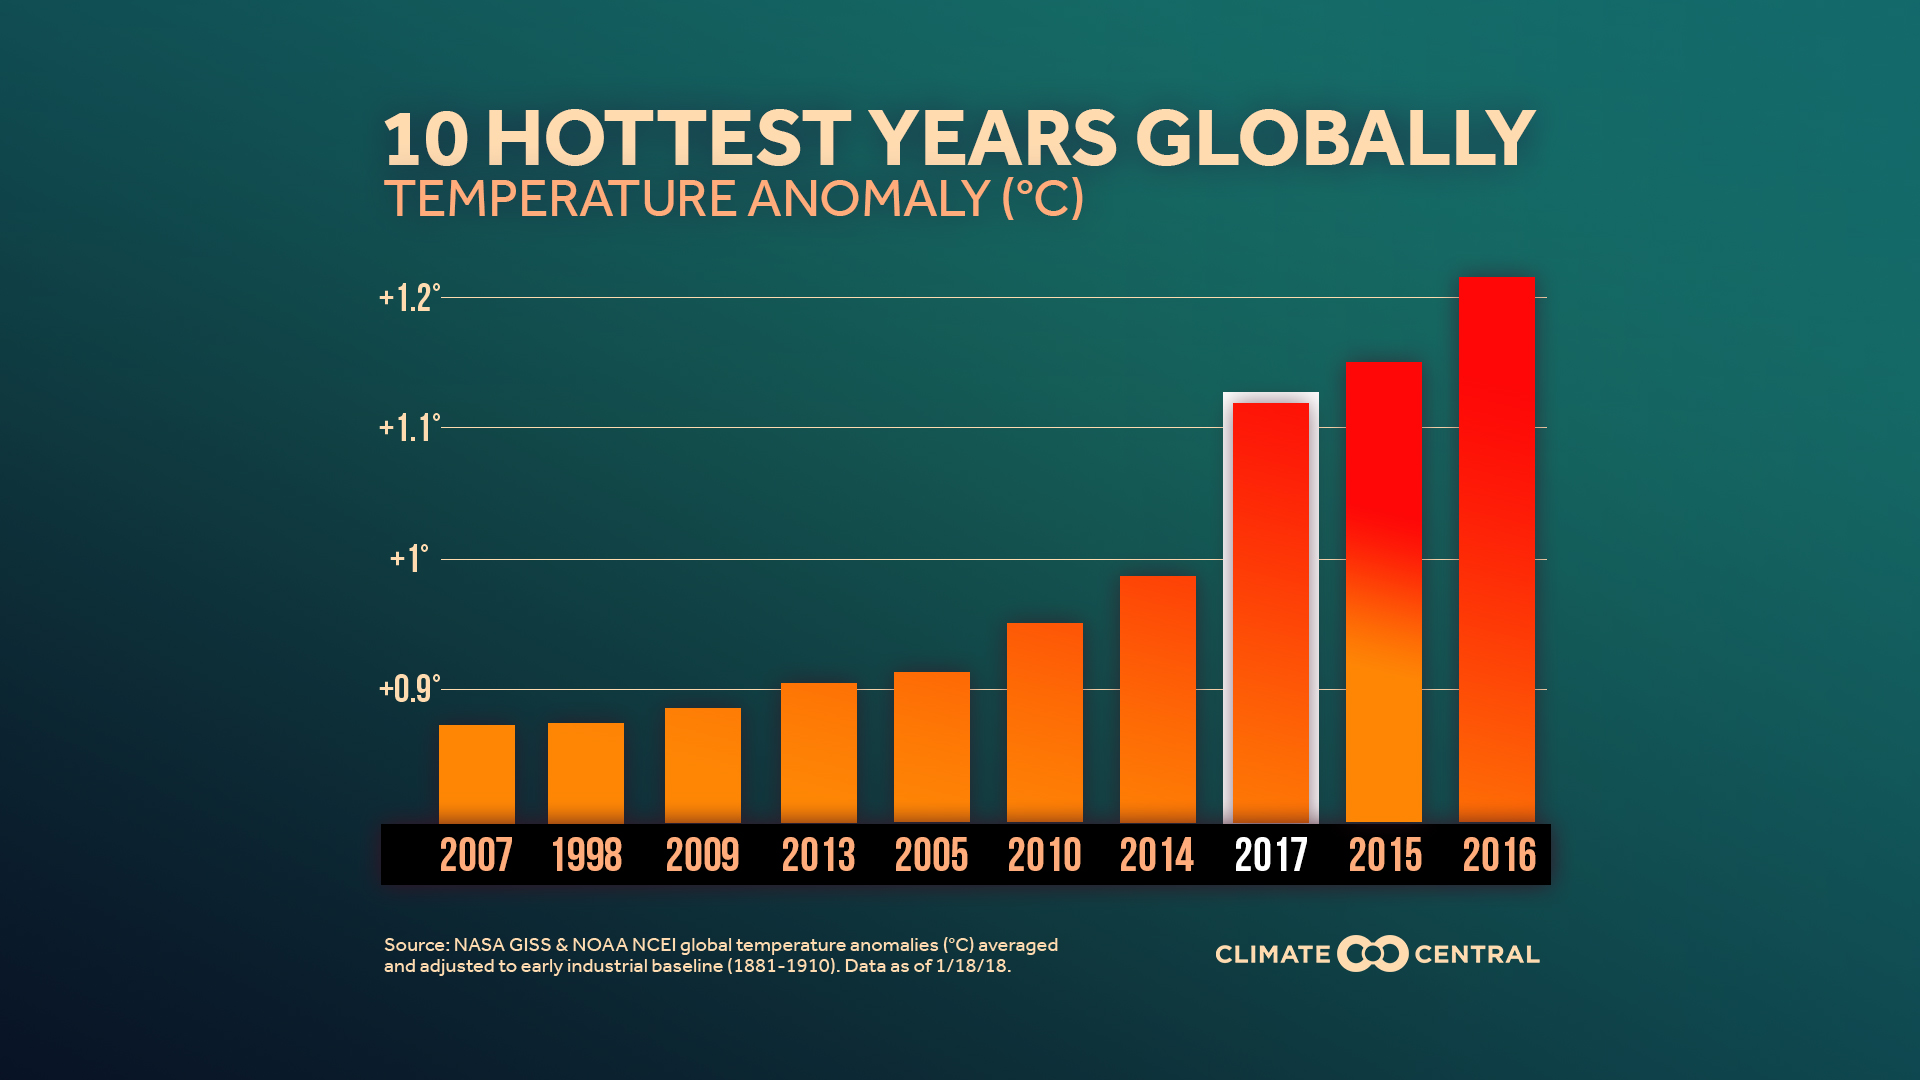
What’s scary about the Climate Central chart is that 1998 was the last strong El Nino year of the 20th century compared with 2016, which was the first strong El Nino year of the 21st. El Nino causes a spike in the stats, but El Nino or not, the overall trend is up, up, up.
For more interesting global statistics for 2017 see:
https://www.wunderground.com/cat6/noaa-earth-had-its-third-warmest-year-record-2017
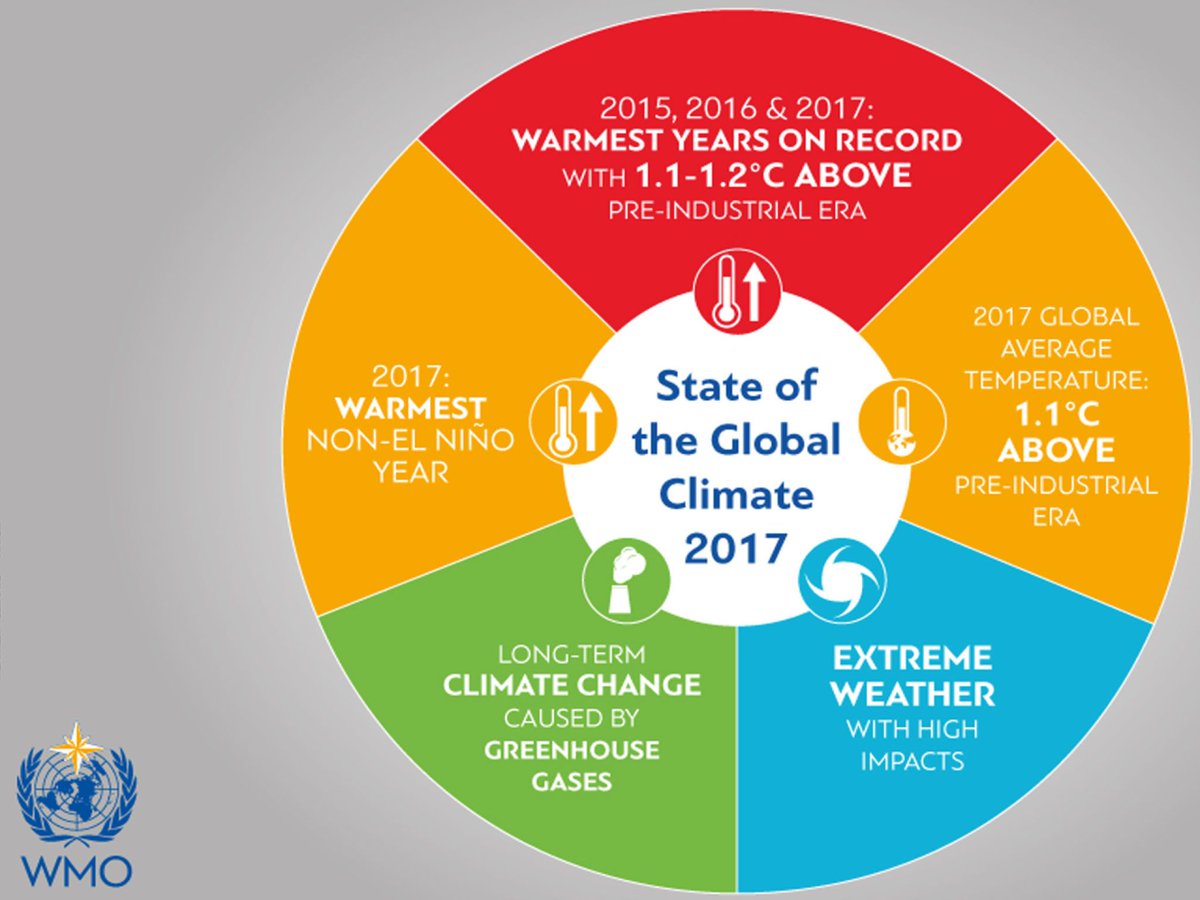
I cant stress enough that experts have stated that global averages need to remain below 1.5 C above Pre-Industrial levels in order to retain a stable climate, so the people of Earth have very little time to get their house in order.
………………………………………………………………..
I haven’t seen any major reports of records today.
The Climate Guy