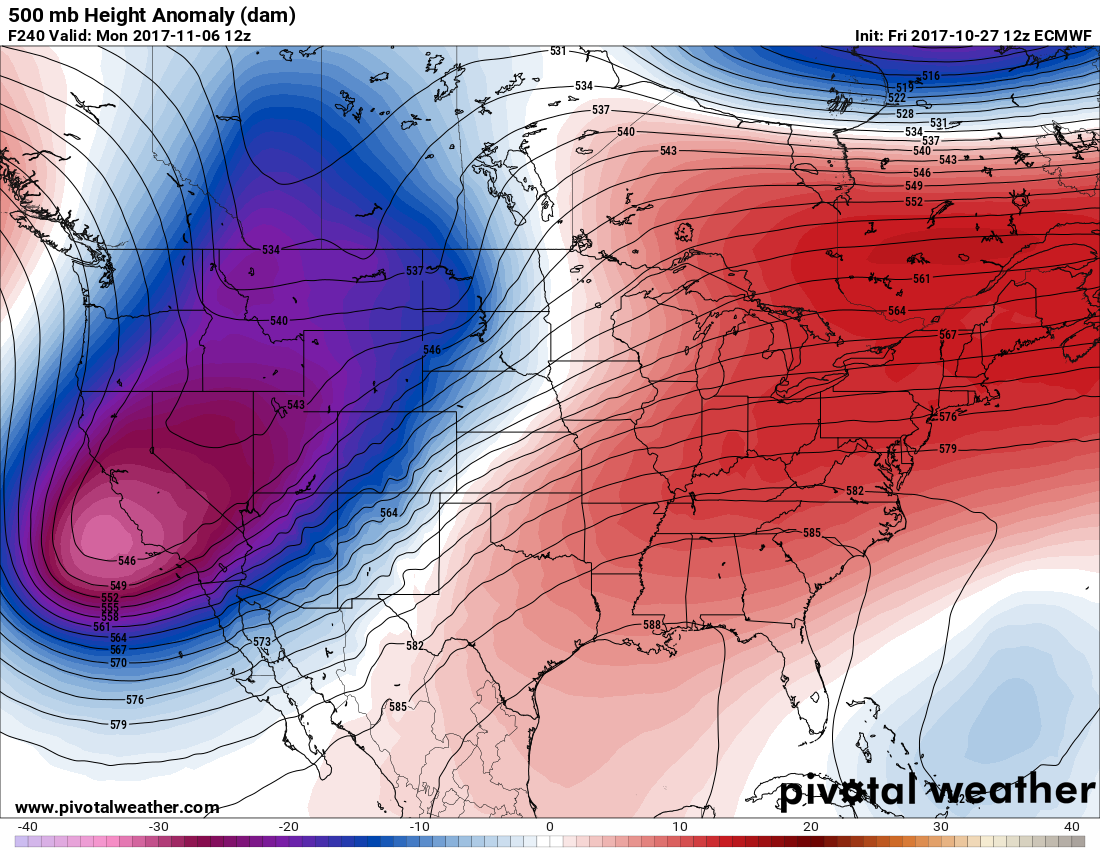
Tuesday October 31st… Dear Diary. Boo! Happy Halloween. Let’s see if there will be any scary climate change warmth going into early November across the U.S. Computer models have done very well forecasting general switches in weather patterns the last few months. Here we see that the mean trough will shift back to the West with above average 500 mb heights by the third of the month and continuing through at least the seventh:
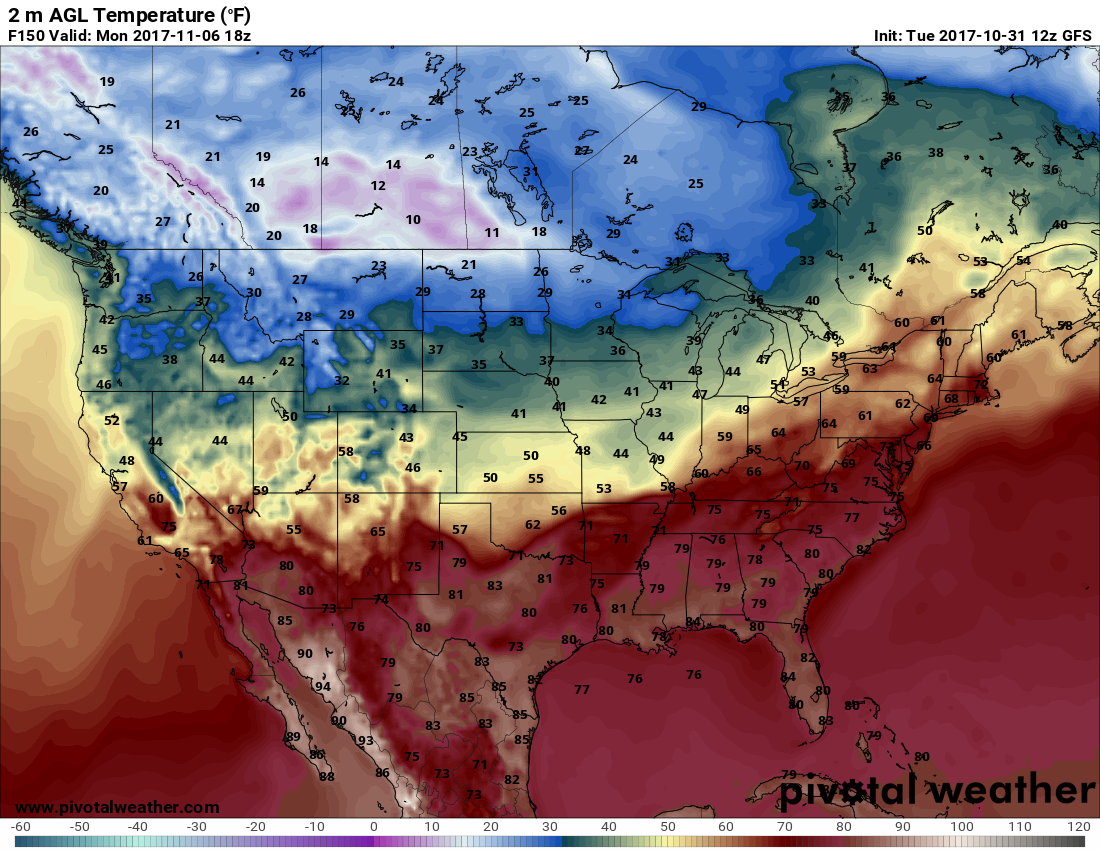
I suspect that November will start out warmer than average east of the Rockies with some record warmth, but how anomalous this pattern will be is uncertain. Scanning forecast model temps I see warmth, but extreme warmth isn’t apparent. Here is an example valid for the 6th:
Of course, if I see any more hints of either record heat or cold I’ll post that information.
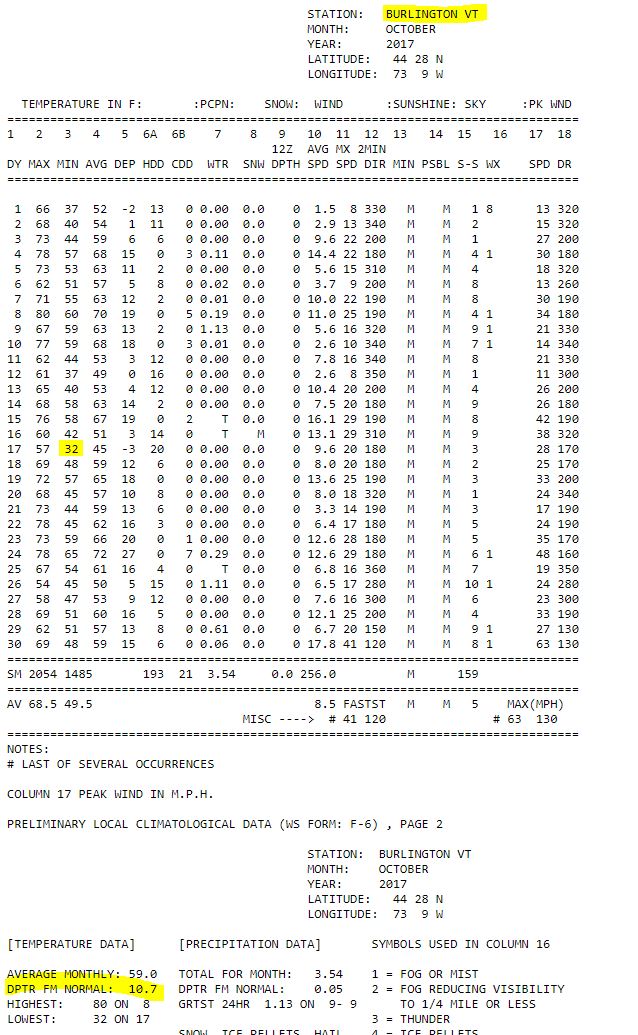
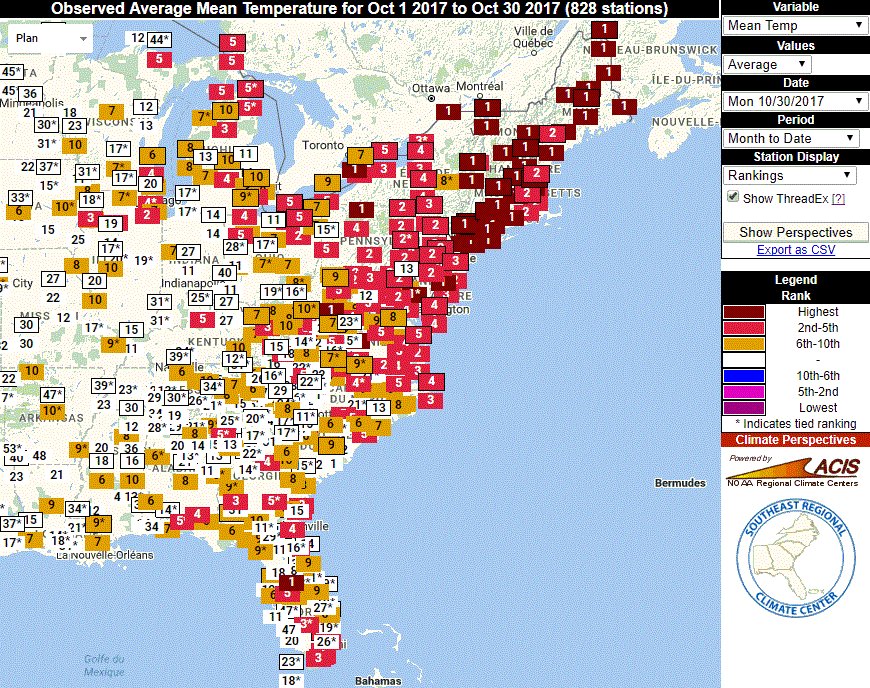
The Northeast has been astoundingly warm in October. From Bill Karins: Burlington, Vermont should have its warmest October in recorded history, not seeing a killing freeze yet:
At Central Park in New York City October 2017 will go down as the warmest October in 147 years of record keeping. Here are some other toasty rankings for the Northeast from Etienne Kapakian (@EKMeteo):
The Climate Guy
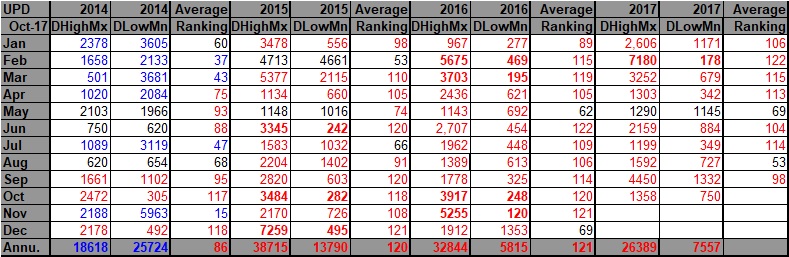
Sunday October 29th… Dear Diary. The NCEI records site has accumulated counts through 10/25. Please see prior posts to note that we had a mini, summer-like heatwave from 10/23-10/25 in the Southwest. The number of new daily record high maximum counts added, so far, have pushed the ratio of DRHMX to DRLMN for OCT 2017 to nearly 2 to 1:
One of my goals for this blog is to demonstrate on nearly a daily basis how these record counts are skewed towards warmth, and thus have a climate change signal. As we move forward in time I’ll point out synoptic weather patterns that potentially will set record temperatures. Keeping that in mind let’s see how many points the “warm team” raked up from OCT 13-15. Using the NCEI Records Site I see:
265 DRHMX 354 DRHMN 11 DRLMX and only 9 DRLMN
As would be expected the majority of the daily record high max and high min reports were from Arizona, California, and Oregon. All records are cataloged here if you wish to check: https://www.ncdc.noaa.gov/cdo-web/datatools/records
Records get cataloged into the system in “spurts” when there is a synoptic pattern hot or cold enough to attain extreme temperatures across part of the nation. Usually if temperatures are extreme enough to get a new record at say a main line station such as Pasadena CA there are many other records set at surrounding minor stations; hence we see a “spurt” of new record reports getting into the system, especially if it gets hot or cold enough to get new monthly records. In the case of the latest heat wave the system did report one new monthly record at Heber AZ, which got up to 91F on 10/23.
I suspect that it will take a few more days to see more complete reports of daily and monthly records from 10/23-10/25. I’ll update this post once more come in.
In order for October 2017 to not go in my record books as the 35th consecutive month of more DRHMX than DRHMN in the U.S. the “cold team” is going to have to throw some hail Mary passes. Due to the current cold wave across the Midwest and eastern U.S. the cold team has a shot, but I think they will come up short. We will see.
The Climate Guy
Friday October 27th… Dear Diary. Now you see it now you don’t. As quickly as the near record setting cold shot will move into the eastern U.S. the weather pattern will change such that temperatures will moderate. As might be expected across a warming planet cold shots will be of shorter duration, become less frequent, but will occasionally occur. By 11/06/17 the trough has lifted out of the East and been replaced by a ridge. A new system will cool off the West:
The pattern change can be seen looking at a broader view on those Penn State ensemble charts:
Here we see that the negative phase of the North Atlantic Oscillation that I described yesterday has been replaced by the positive phase…A ridge over Greenland is forecast to be replaced by a cold upper low (in this case centered north of Hudson Bay). Usually the positive phase of the NAO allows a heat dome to build over the eastern U.S.
So far, there are no indications of widespread record warmth coming to the East from this pattern change, but I’ll keep all informed on any changes.
Now back to the cold shot. Cold air will be plunging through the Plains such that by Saturday morning thirties will be making it as far south as Louisiana and South Texas:

The NWS has issued an impressively large area of freeze warnings for tonight (in blue):

Quoting my friend Bob Henson of the Weather Underground Category 6 Blog: “Irony alert. The freeze warnings are so widespread because there’s been so little freezing weather thus far.” Yes, due to climate change first frost and freezes are generally coming later in the year.
I’ll add more to this post as pertinent information crosses my radar.
The Climate Guy
Thursday October 26th… Dear diary. The heat wave in California is waning quickly. While remaining warm with above average temperatures, there should not be many more records coming from the West for the remainder of the week. Now our attention turns to the next weather, or synoptic event, that may produce record temperatures. Surprise! We actually might rack up some points for the “cold team.” I saw this note from MDA Weather Services this morning, “This week’s chill could approach record levels in the Southern U.S. including in the Houston area where lows are projected in the upper 30’s Sunday AM”:
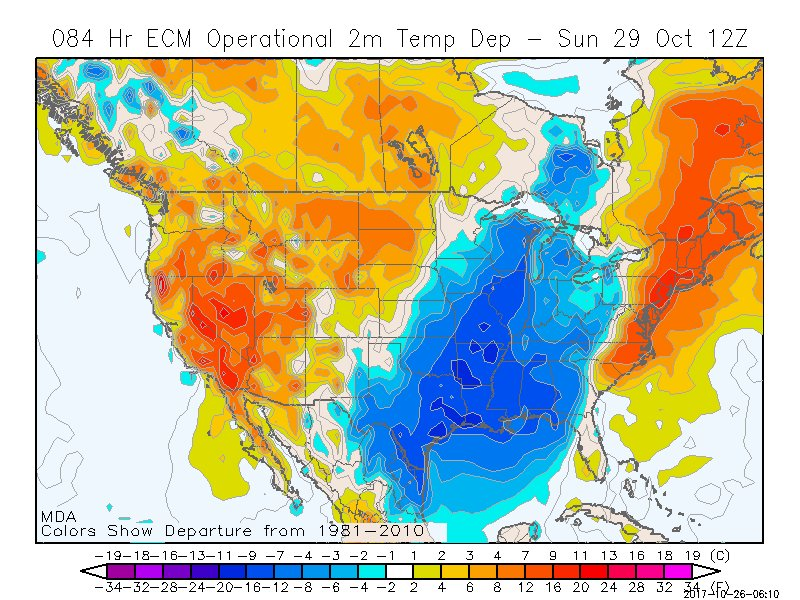
Let’s look at the 500 Mb pattern in association with this cold event. Here is what we see for Sunday morning from the GFS:
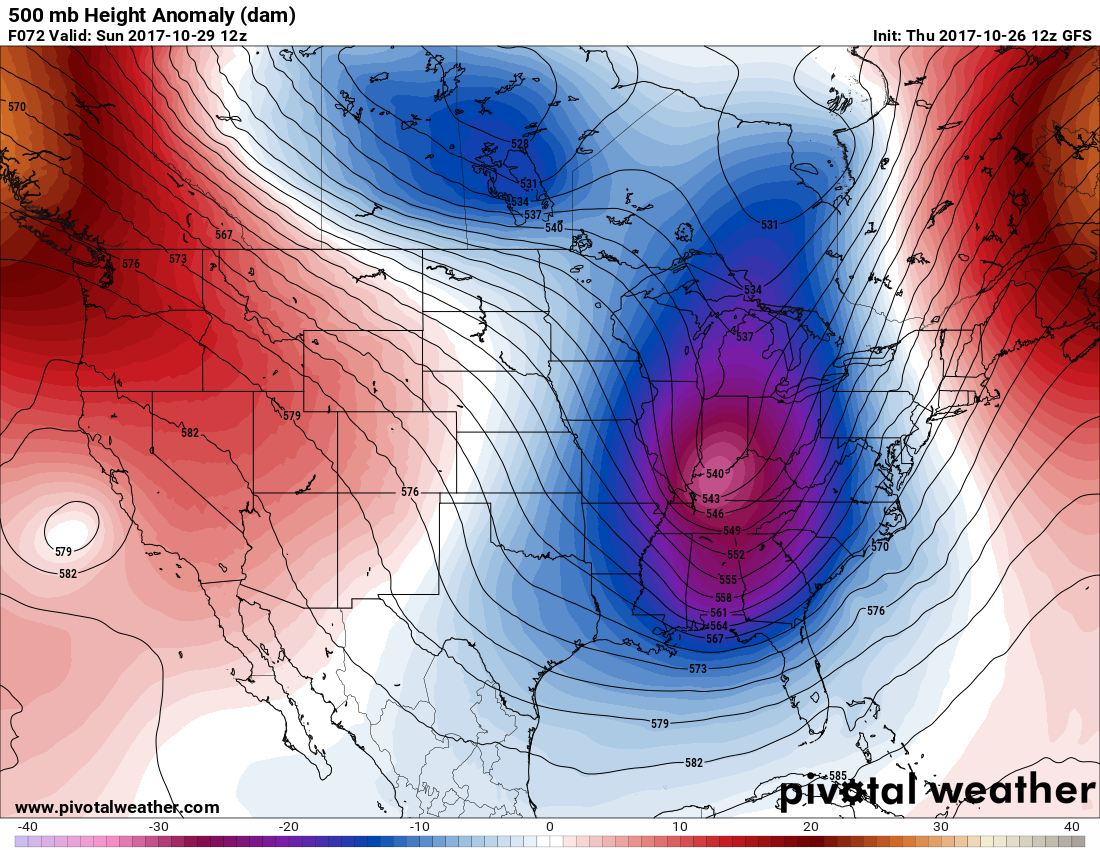
On the Pivotal Weather 500 mb anomaly chart we see deep blues from the Midwest through the South in association with a strong looking system. In the wake of this front here are the forecast two meter (near surface) model temperatures:
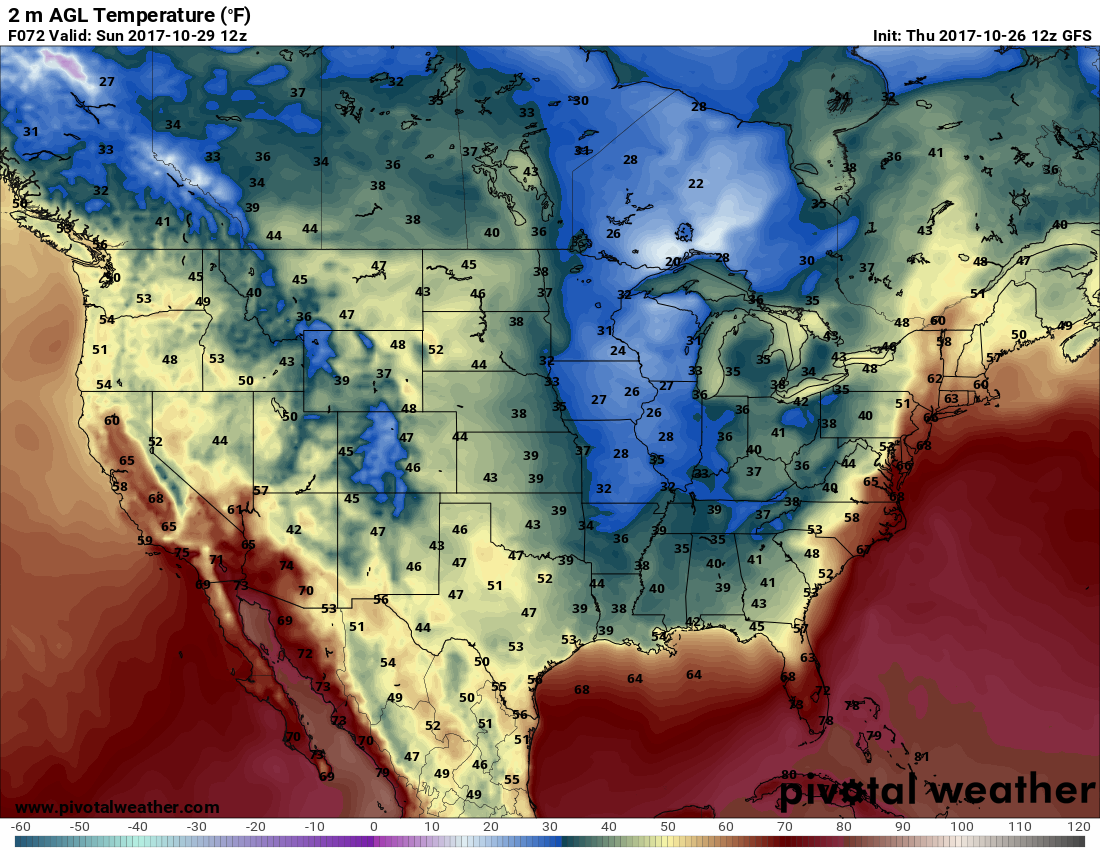
Indeed, the latest GFS forecasts chilly 30’s as far south as the Gulf Coast Sunday morning.
This weather pattern is in response to the jet stream getting pinched off over the eastern U.S. between the ridge over western North America and a building ridge over and around Greenland (The negative phase of the North Atlantic Oscillation) as depicted by this Penn State ensemble chart:
I am very certain that we will see this cold outbreak since the white lines(operational model) looks like a good average of all the green, blue, and red lines (ensemble members). These days of AGW it takes a strong, anomalous pattern to produce any record cold. Keep in mind, though, the Meehl Record Study that I was a part of forecasts that there will be record cold patterns, occasionally, all the way through the end of this century.
I’ll be adding more to this post as relevant information crosses my radar.
The Climate Guy
Here in NW Missouri we got a Halloween treat, snowflurries!