Sunday August 27th…
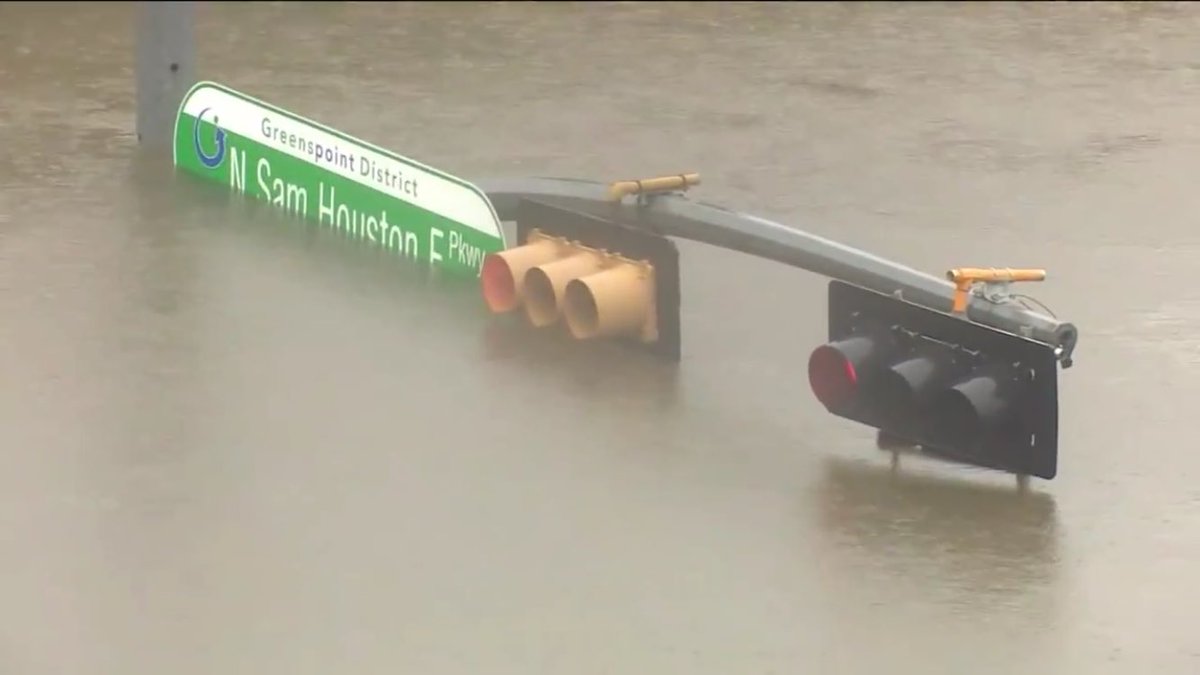
Dear diary. About the worst case scenario has happened. Indeed Harvey has become Texas’ Katrina, and like Katrina the most impactful damage is due to flooding. Almost unfathomable amounts of rain, meteorologically, have fallen and will continue to fall in association with Harvey. This picture is from Kevin Seller (@KevinSeller)) taken front an intersection along Sam Houston Parkway where the water is about 17 feet deep!
Here is another photo from Eric Holthaus…Yep there are no words…
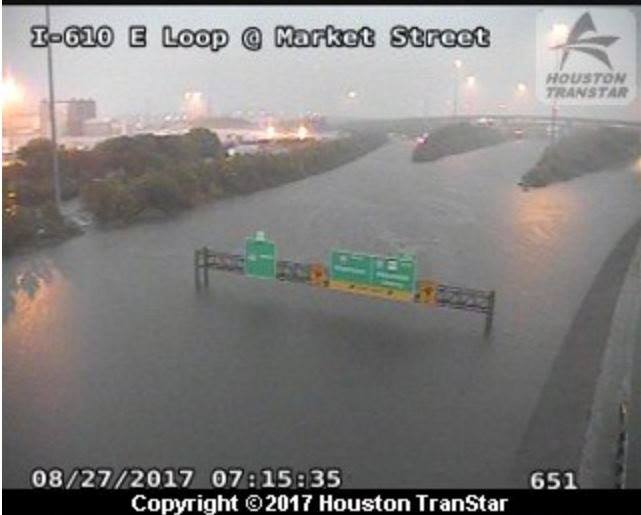
Most areas across Houston are not covered by 17 feet of water, but flooding is getting worse.
Here is the expected additional rain in southeast Texas bringing the total to Houston to about 50″ once all is said and done:

Yowza! Could we be breaking an all-time U.S. rainfall record? Take a look at this graphic from TWC’s hurricane expert Michael Lowery:

Bob Henson on Category 6 goes into great detail about the future of Harvey and its future rainfall. I do advise all interested to read this:
We can’t totally blame a carbon pollution, ramped up, slow moving hurricane on Houston’s woes. Add a dash of unregulated growth and you have a great recipe for a major disaster:
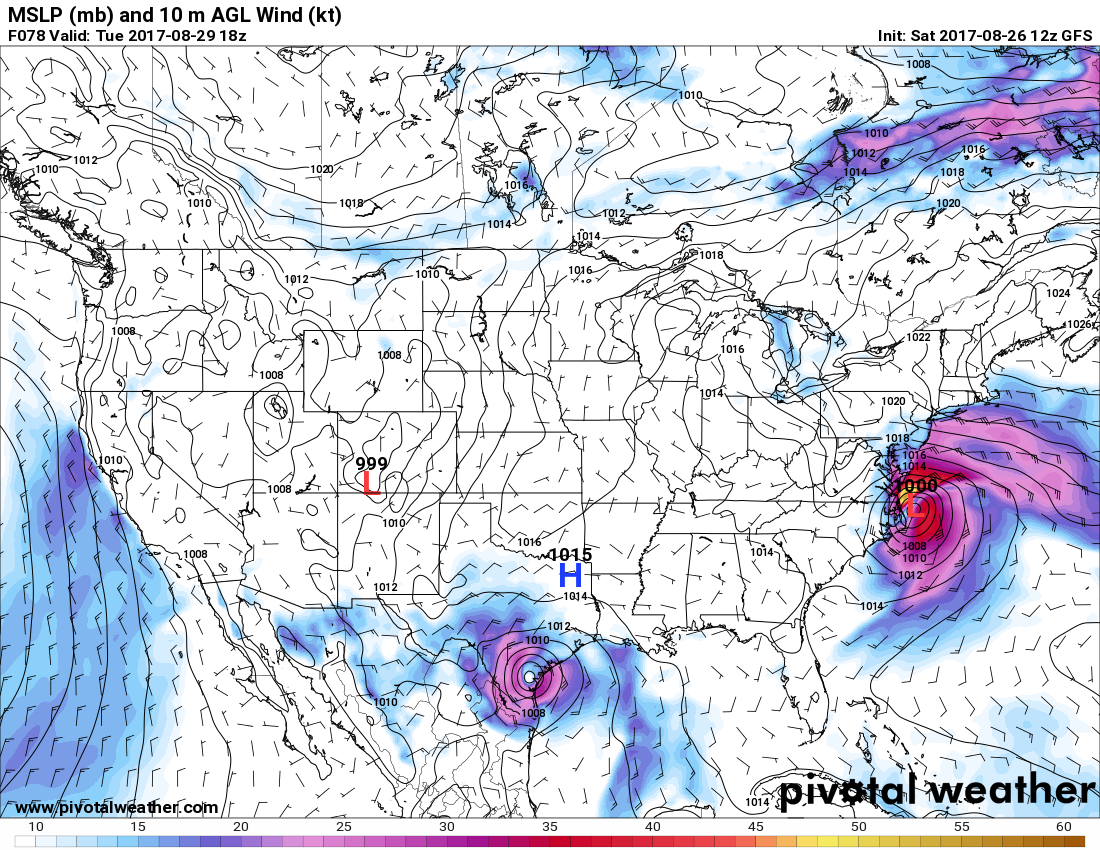
The most reliable model, the European, takes Harvey back offshore prolonging the misery. While the system may not strengthen much, its slow southward movement will focus redeveloping bands of heavy rain into southeast Texas at least through tomorrow night. Nighttime dynamics should produce another round of 15″+ amounts tonight.

By Monday and Tuesday, while Harvey will be flirting with a comeback another system will be in its formative stages of development along the Carolina coast.
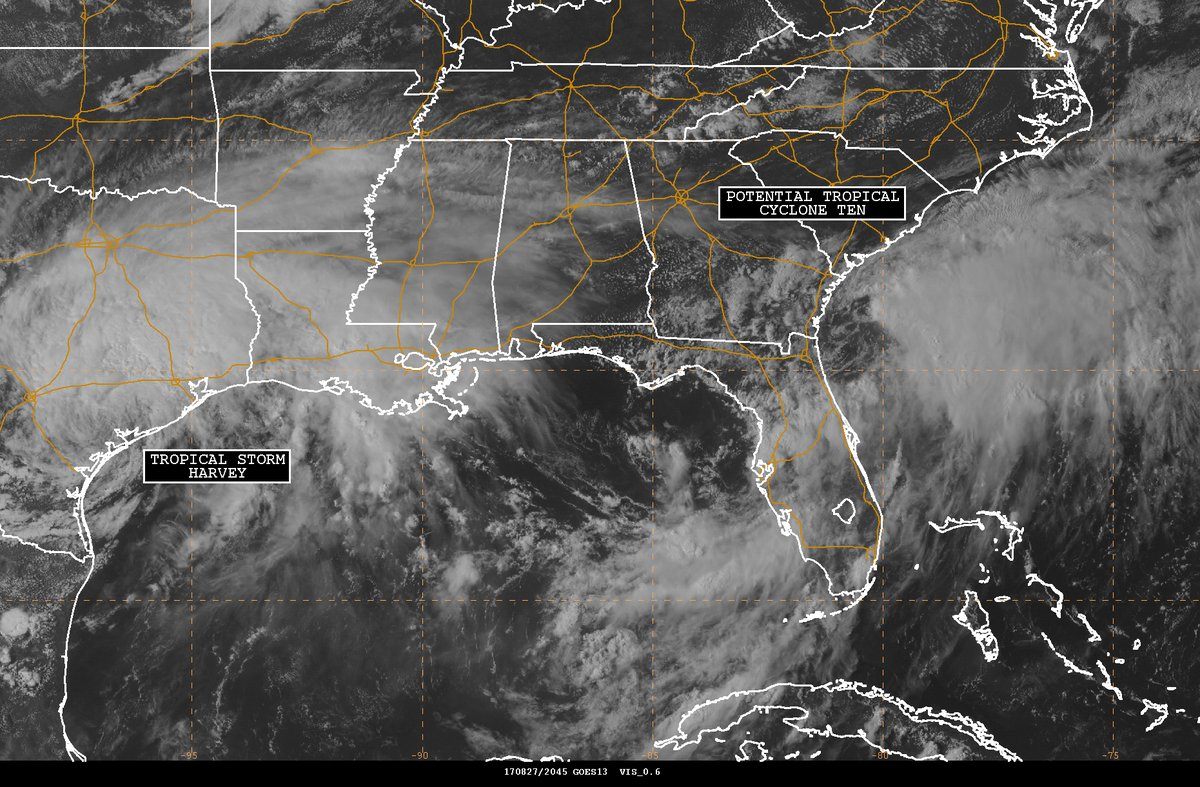
I suspect that we will see Irma being named, although this system won’t be entirely tropical. Irma even if not being named before leaving the Carolina’s will cause some local flooding and beach erosion. There is some good news here. Irma should move northeast away from the Northeast and New England, although the system could deepen enough to give the Massachusetts Cape a few headaches.
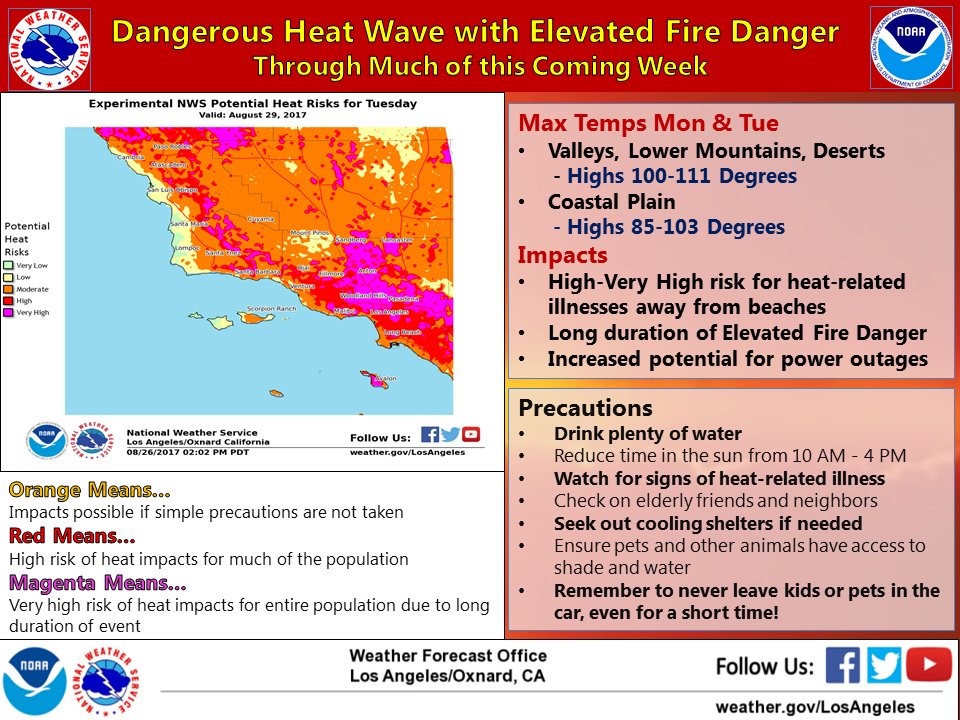
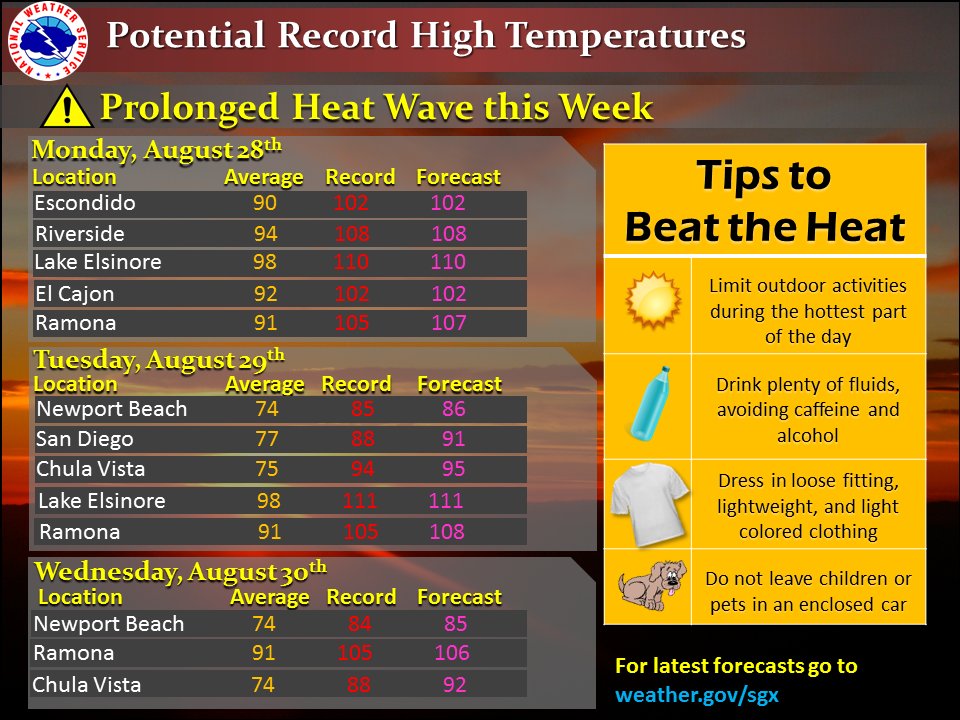
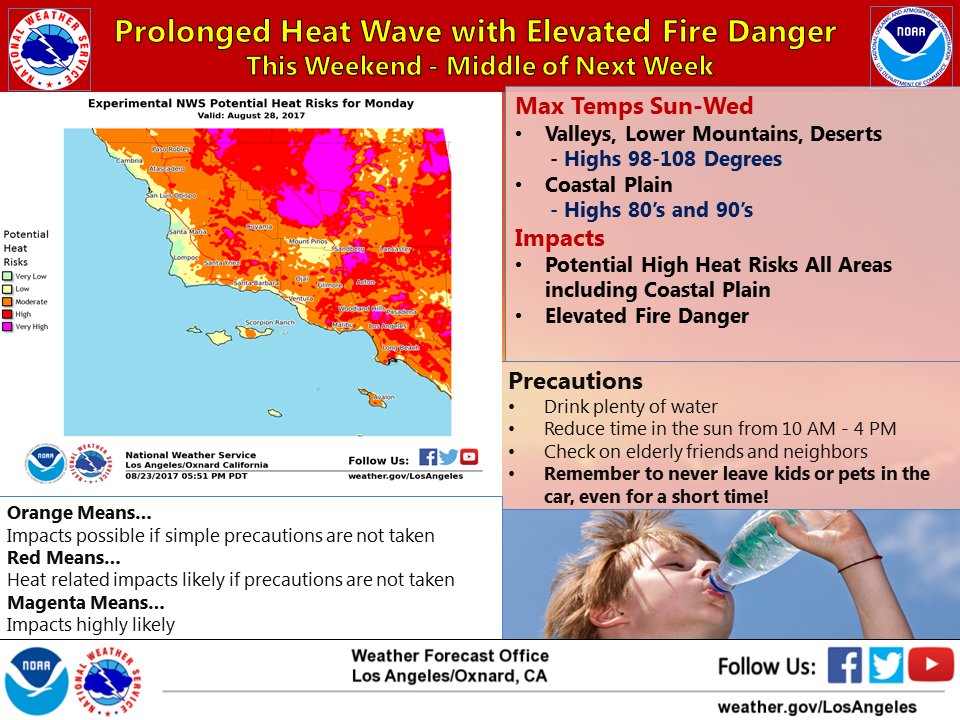
Now let’s get to more specifics on the western heat. Let’s call this episode heat wave #8. Here is what is expected in Southern California this week:
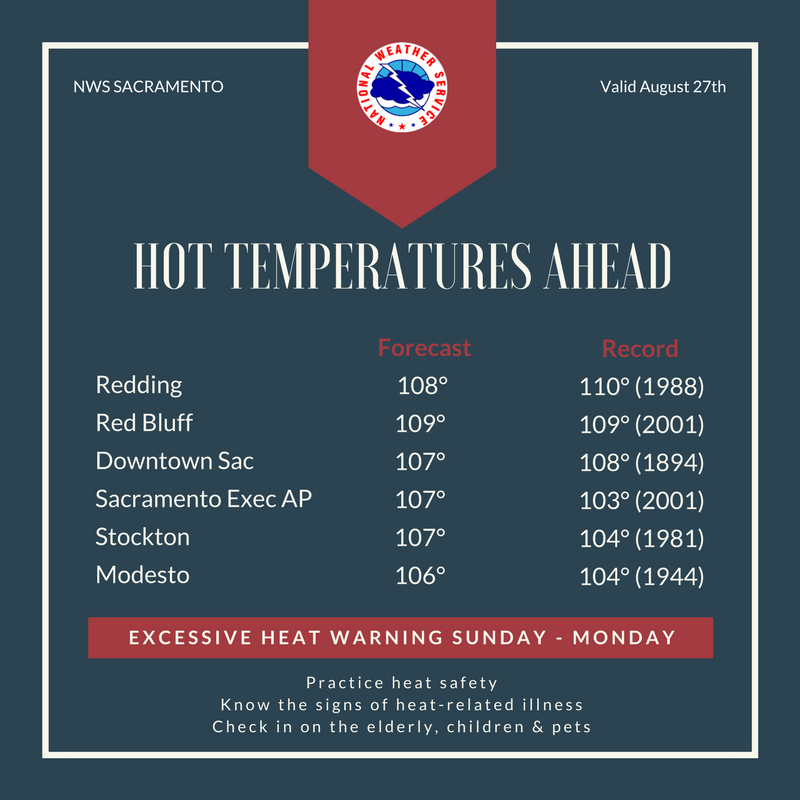
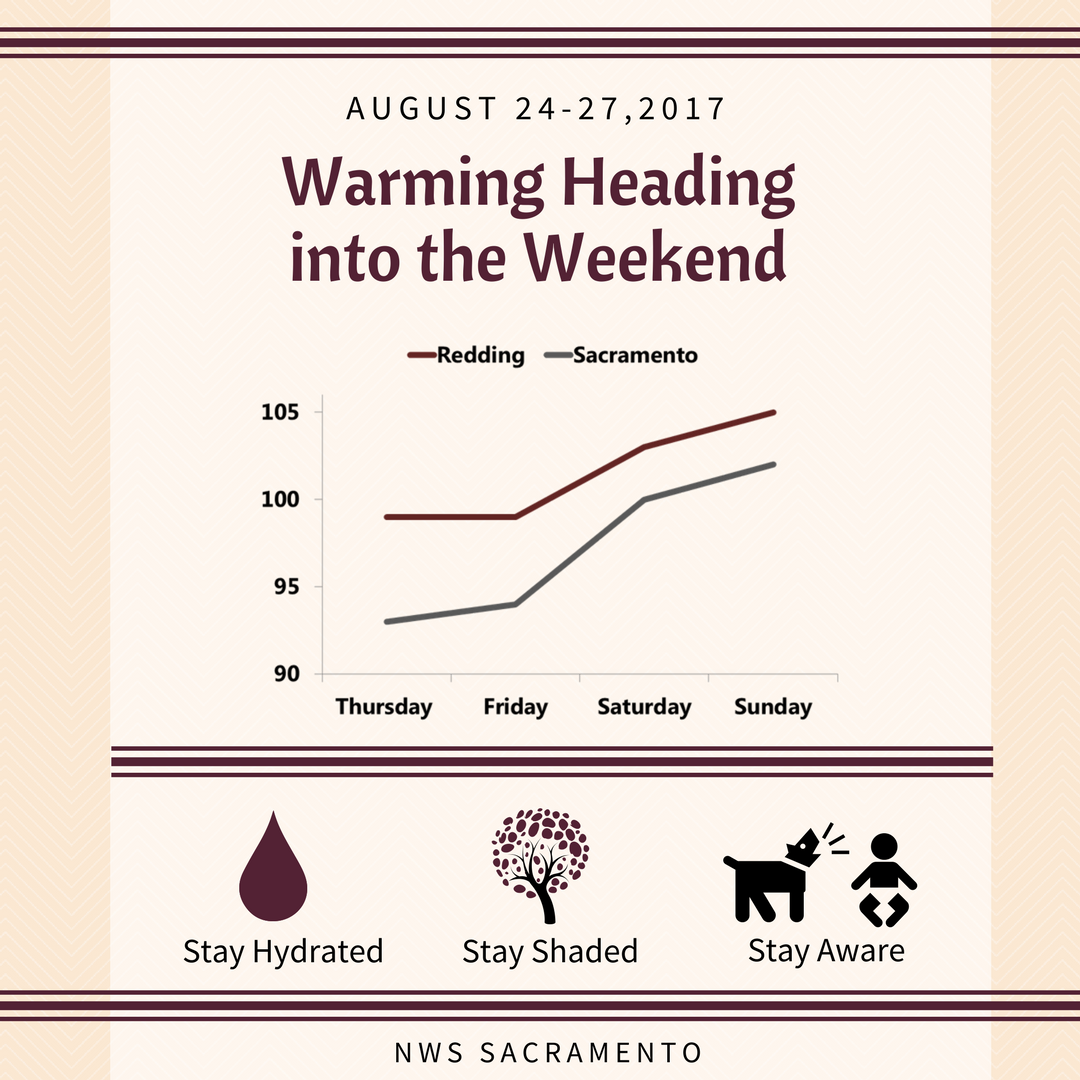
Also in the Sacramento Valley:
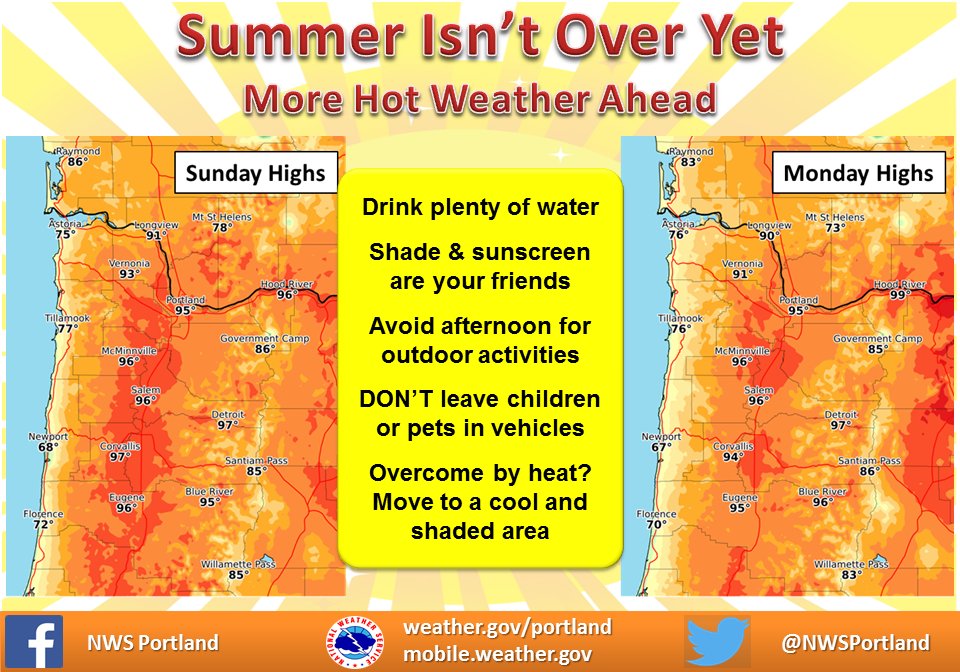
And in western Oregon:
Sunday Evening Updates…
Records are starting to fall from heat wave #8. Geez… One huge U.S. city is underwater while another roasts:

Here are more records that are expected to fall from NWS San Diego:
I’ll be adding more relevant information to this post as the day progresses.
The Climate Guy
Saturday Evening Updates:
Dear diary.
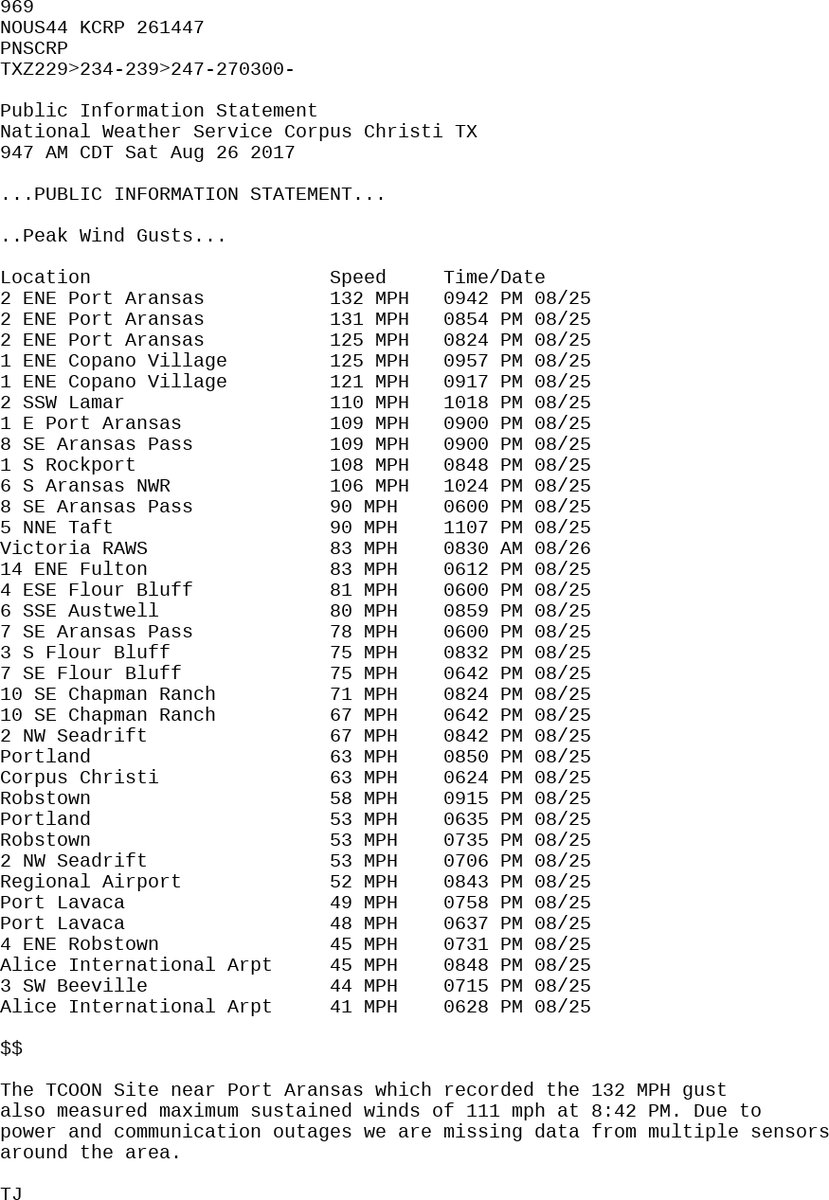
Here are some peak wind gusts reported from Harvey:
Tonight there will be widespread flood emergencies in Southeast Texas. This is a crisp graphic from Erik Taylor (@WeatherErik) depicting how much rain is expected from Harvey:

As far as river and stream flood stages go, here is another eye opening graphic from Garret Bedenbaugh (@WeatherGarret)

Here is another graphic from Erik Taylor (@WeatherErik) showing what has occurred in association with Harvey so far:
I would highly recommend reading this post from Dr. Marshall Shepard about what is to come with Harvey. Two big words: EPIC FLOODING
Please remember, one of the biggest reasons Katrina became “Katrina” well after landfall because the New Orleans levees failed leading to horrible flooding. Harvey will be refereed to as “Harvey” historically due to the flooding to come.
I’ll be updating this post through tonight.
The Climate Guy
Saturday August 26th…
Dear diary. Where to begin. There is just a mindboggling amount of material to cover. This blog post has certainly switched from the subject of dangerous heat to the tropics. Today, however, we will be covering both.
First, I am now seeing ominous signs of what is meteorological speak rapid cyclogenesis near the North Carolina coast early next week leading to a hurricane off the East Coast. The Canadian model first picked up on this a couple of days ago. I posted this chart on Facebook last night:

The Canadian model did a fairly good job with Harvey. Now the GFS model today is swinging towards the Canadian solution forming Irma:
All guidance, so far, takes the next hurricane, Irma, thankfully, out to sea, but this system will at least have effects like beach erosion and alarm many people.
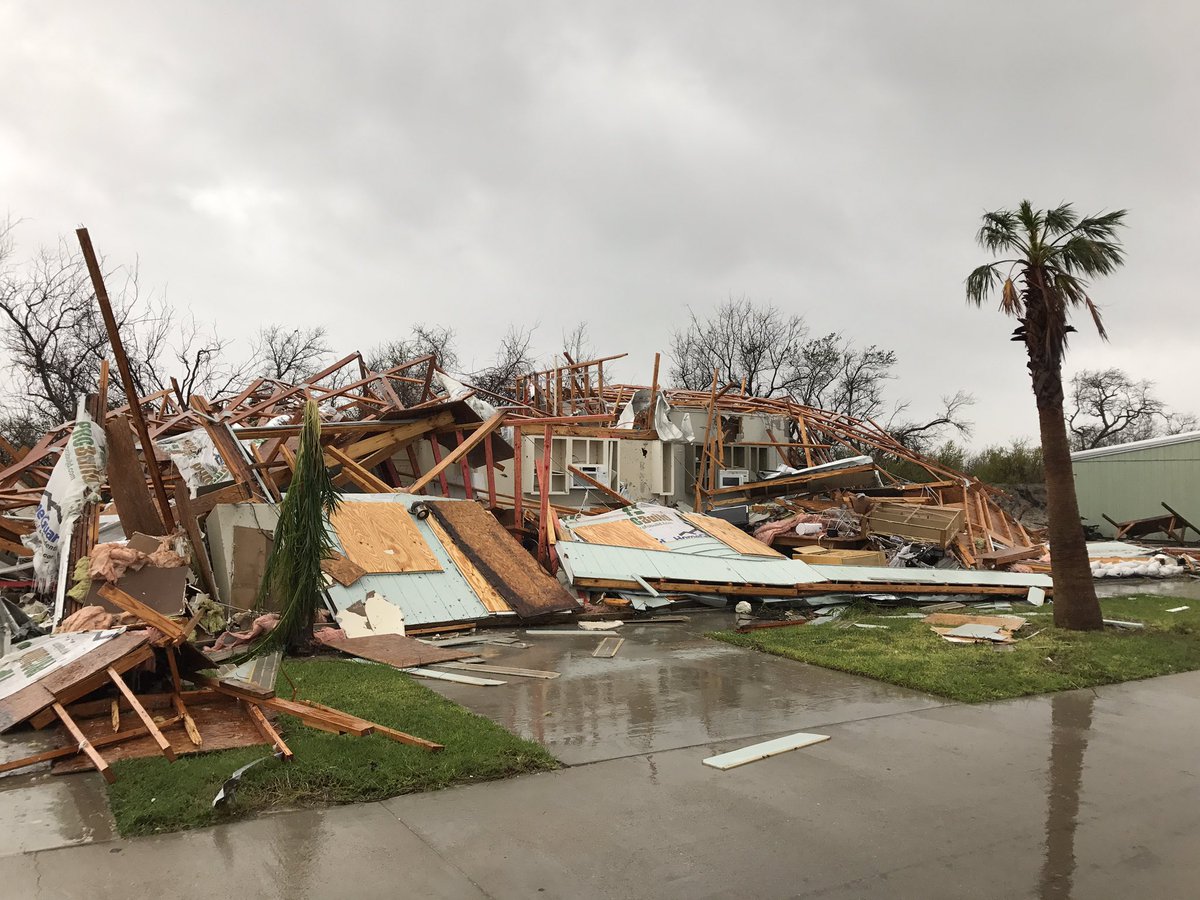
Meanwhile by Tuesday Harvey remains stuck over Texas adding to the misery from what I contend has already become Texas’ Katrina. Here is a photo from ground zero of Harvey’s landfall last night, Rockport TX (Image from Mike Theiss):
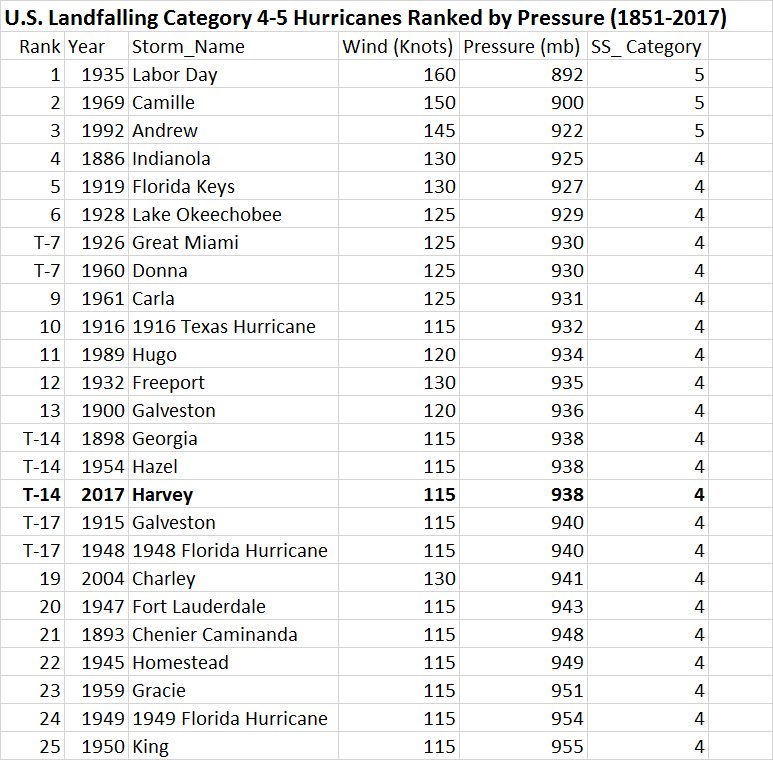
Here is Harvey’s ranked pressure at landfall from Philip Klotzbach:
There has been no change to the forecast of a widespread area of 20-30+ inches of rain in association with Harvey. Rain bands are rotating around the system which is just about to stall near Victoria TX. Here is the GFS ensemble accumulated forecast for the Houston area. (Image from Morgan Palmer):
AAndA
Here is a great graphic from Jeff Havlerson (@capitolweather) detailing how a tropical cyclone can squeeze out so much moisture days after landfall:
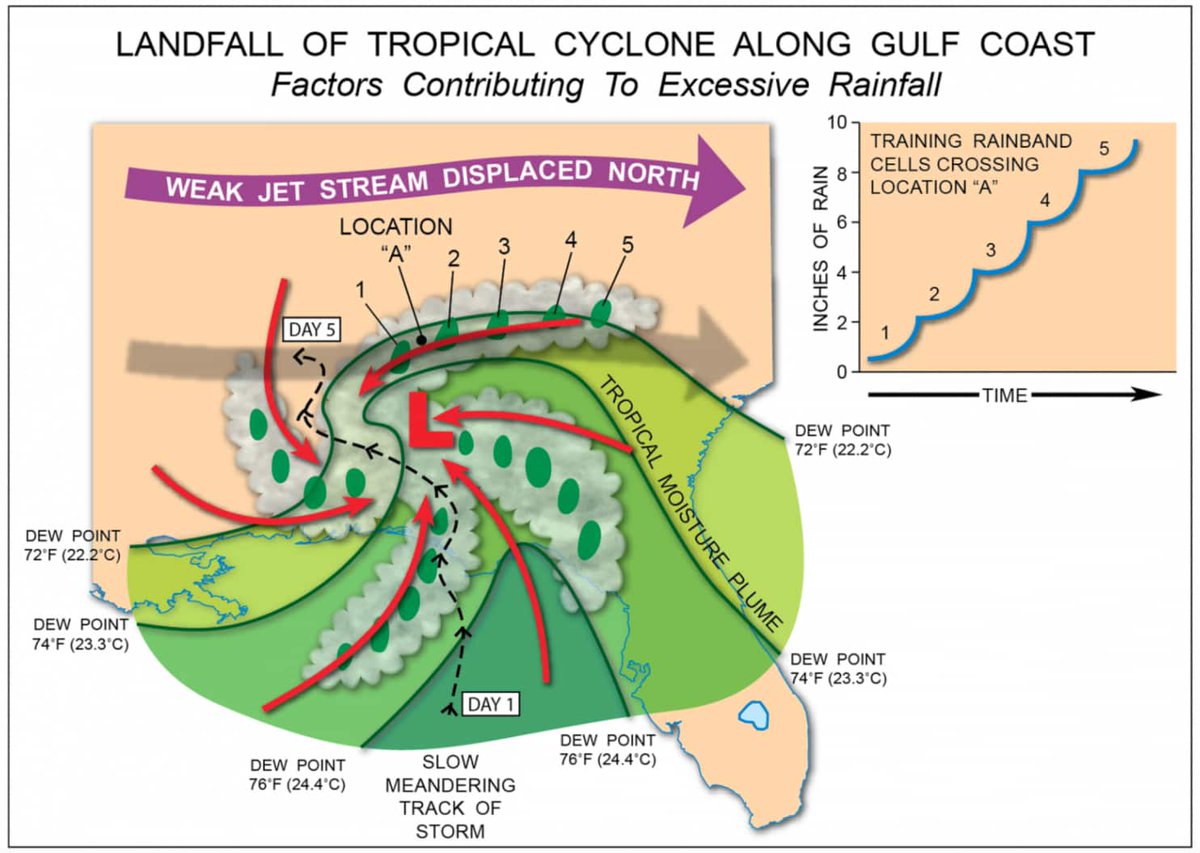
Jeff’s article is here: https://www.washingtonpost.com/news/capital-weather-gang/wp/2017/08/26/how-can-tropical-storms-like-harvey-generate-such-unbelievable-amounts-of-rain/?utm_term=.28dd8d03b81b
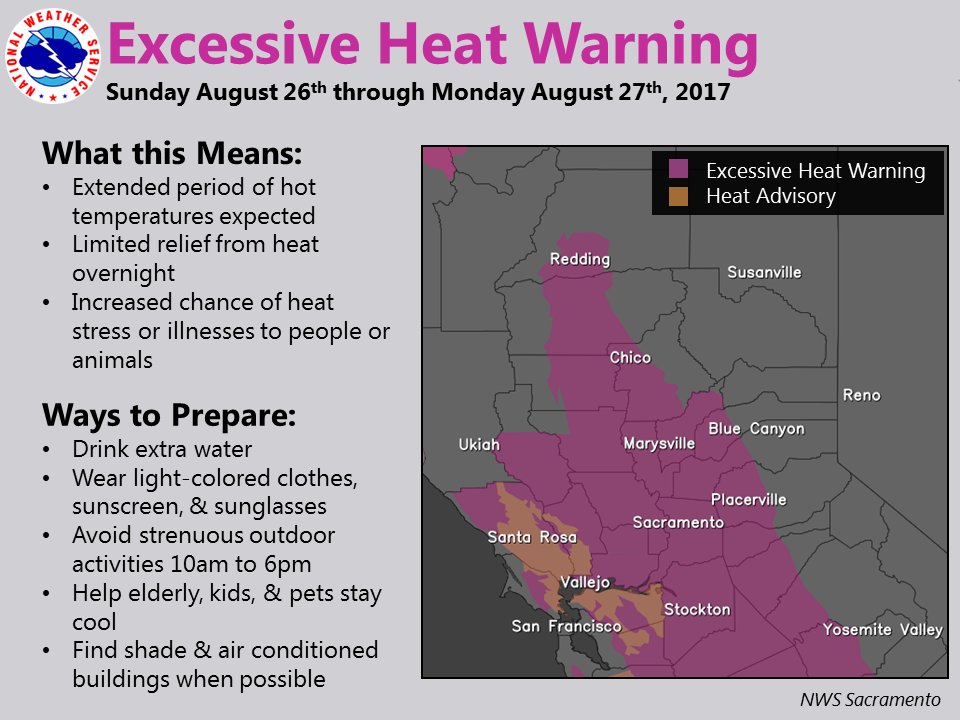
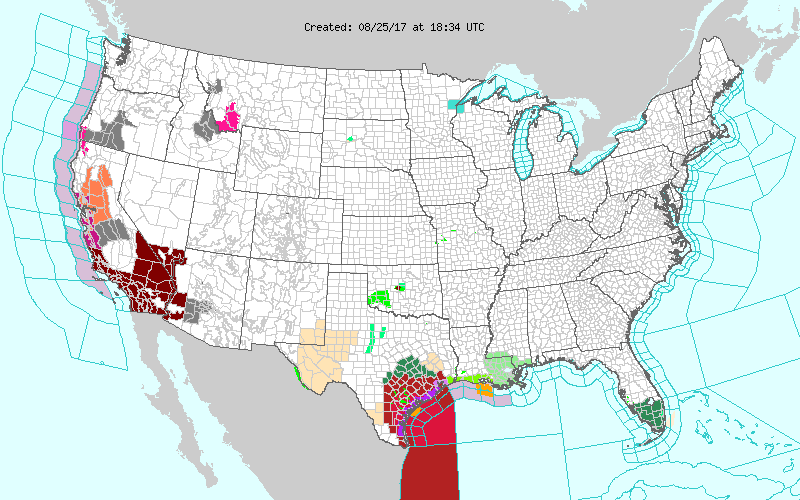
And now to the western heat. Individual NWS offices are issuing more heat related advisories. Also on this chart you can see the area affected by Harvey:

Also by Tuesday of next week there will be a whopper of an upper ridge or heat dome responsible for record temperatures in the West and blocking Harvey from moving out of Texas:

As an example, here is what is expected in the Sacramento Valley:
I’ll be adding much more to this post as the day progresses.
The Climate Guy
Friday Evening Updates…
Dear diary. Boy oh boy this situation keeps getting worse with Harvey. The only saving grace is that Harvey, now at cat. 4 strength, will move north of Corpus Christi. I dearly hope and pray that somehow this system goes west per this afternoon’s GFS and does not stall and move slowly northeast:

This is a cool graphic showing the top rainfall amounts per state affected by a single tropical cyclone. Harvey will test the Texas amount:

Here is what the Houston area is expecting:

Just to geek out, here is an awesome shot of Harvey powering up just before making landfall near Rockport:

This shot so much reminds me of Hugo. Not many people know that I got in the eye of Hugo while storm chasing in 1989.
I’ll be adding more to this post this evening as relevant news crosses my radar.
The Climate Guy
Friday August 25th…
Dear diary. This is an occasion where hurricanes, heat domes, and climate change all intersect. Harvey will go down in history as a natural disaster made worse by climate change.
Let me make my case for this prior eye opening statement. Scientifically, the factors leading up to tragic events work like a series of dominoes. If one domino is out of place, the rest won’t fall. Last night’s 00Z run of the European model painted a worst case scenario with major Hurricane Harvey moving inland near Corpus Christi, stalling, moving back offshore, then slowly working its way up the coast towards Houston. Besides the wind, large chunks of Texas would be underwater if that European model verified with great loss of life and property. All the dominoes would have to be in perfect alignment for this scenario to take place. Let’s look at each domino one by one.
The first would be climate change related sea surface temperatures, which are the fuel for hurricanes. Here we see well above climatological average SST’s in the western Gulf approaching 90F below Harvey:

The next would be the upper air pattern allowing Harvey to strengthen. Check. This current vortex message has Harvey on the cusp of being a major category three hurricane:
URNT12 KNHC 251528
VORTEX DATA MESSAGE AL092017
A. 25/15:15:20Z
B. 26 deg 45 min N
096 deg 05 min W
C. 700 mb 2631 m
D. 94 kt
E. 325 deg 7 nm
F. 065 deg 102 kt
G. 320 deg 11 nm
H. 947 mb
I. 11 C / 3055 m
J. 17 C / 3049 m
K. 13 C / NA
L. CLOSED
M. C18
N. 12345 / 07
O. 0.02 / 1.25 nm
P. AF305 1709A HARVEY OB 31
MAX OUTBOUND AND MAX FL WIND 112 KT 055 / 15 NM 15:20:00Z
CNTR DROPSONDE SFC WIND 295 / 6 KT
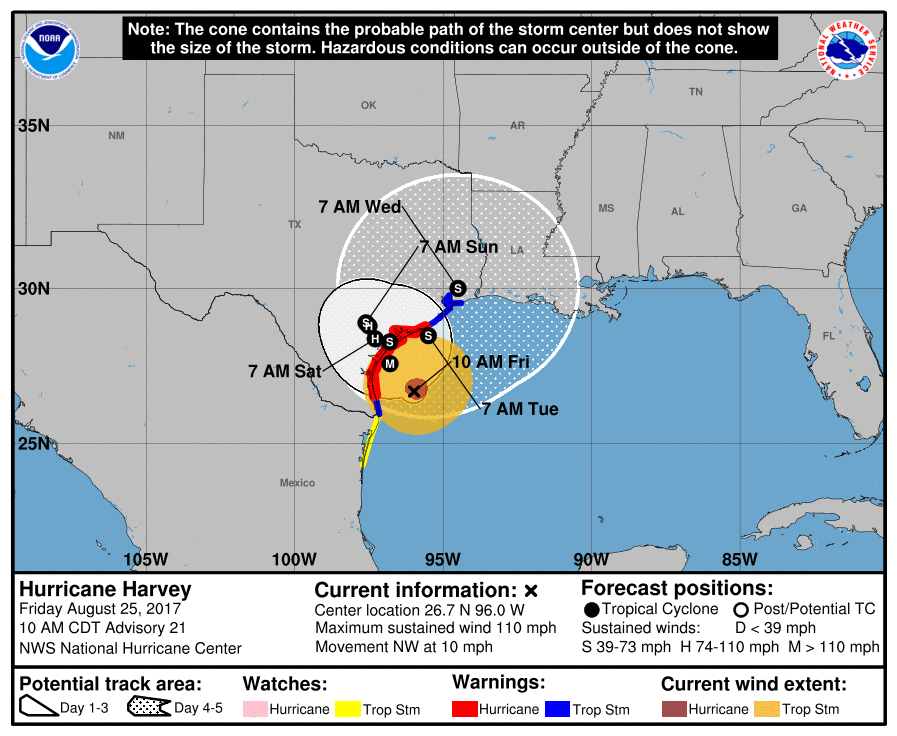
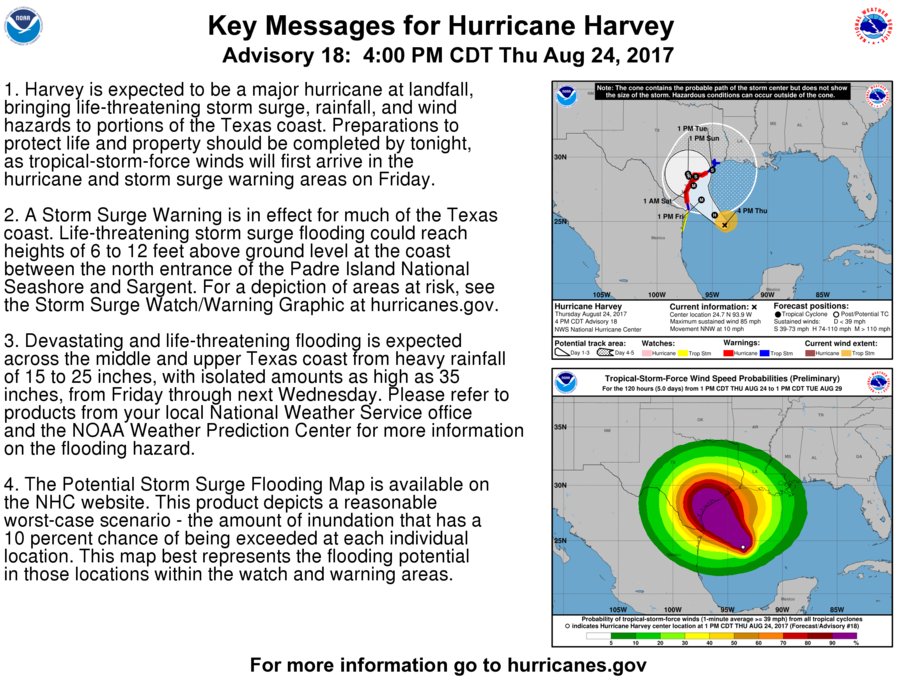
The next dominoes would be the exact path of Harvey and duration of the system near the coast. Here we see that the National Hurricane Center bought the near worst case scenario European model from last night:
The extent of the 20+ inch area on this NOAA qpf forecast is very alarming:
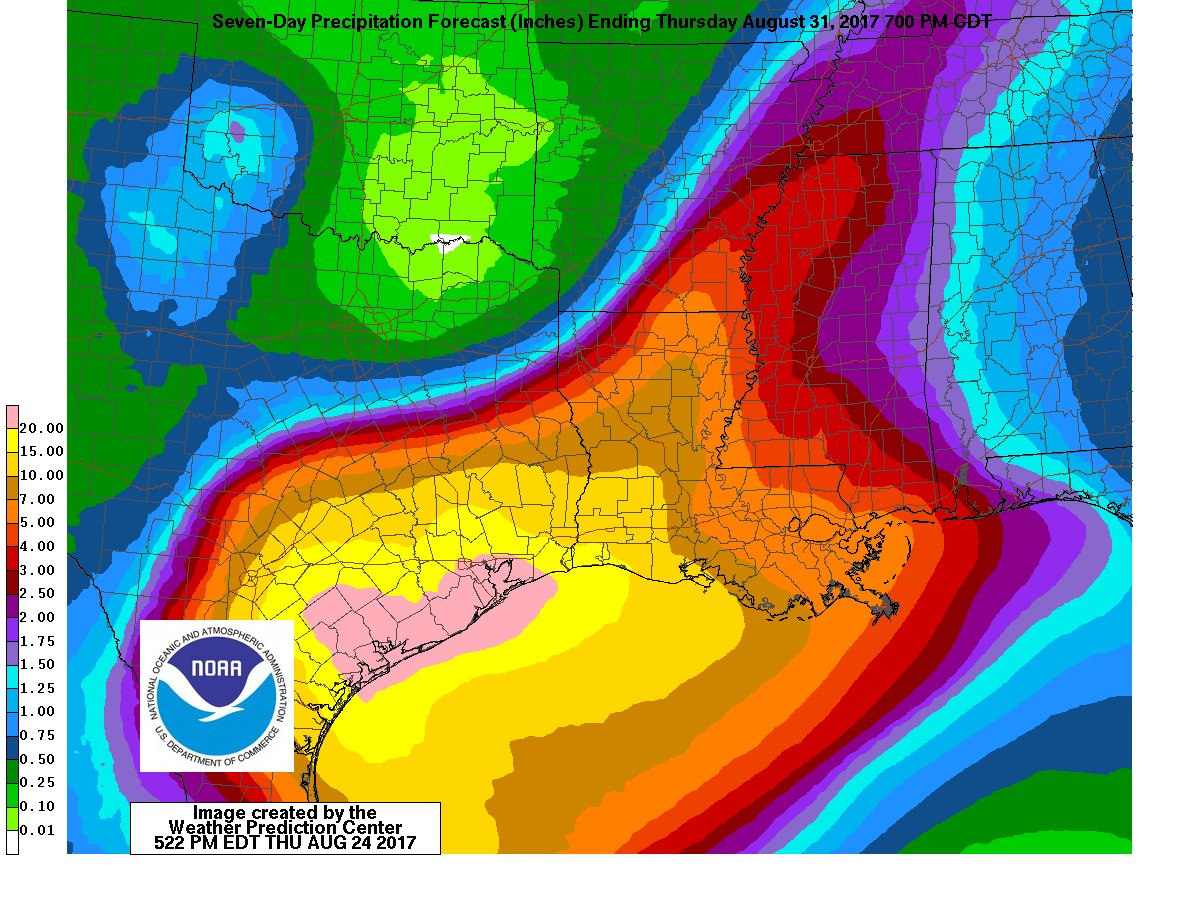
As we have learned in the past decade anthropogenic global warming is making downpours heavier.
So why might Harvey stall around Texas for nearly a week? I strongly believe that that we have a climate change related factor in the works here. Typically by late August steering currents coming from the mid and upper atmosphere are strong enough to move organized tropical systems along after a U.S. landfall. A strong heat dome that I began to blog about yesterday in the western U.S. will be blocking Harvey from moving north in Texas. This heat dome should be of record proportion producing record hot temps in the Southwest and stalling Harvey:
Yet another system will be digging into the Midwest this summer, but it won’t be strong enough to pick up Harvey and move it out of the west Gulf Coast area. Here we see the tracks of hurricanes Celia and Alicia, both of which were historic, devastating storms in 1970 and 1983 across Texas. Notice that both moved inland and dissipated. (Image from the Category 6 Blog):

Unlike Celia and Alicia, Harvey probably will stall then drift due to a ridge leading to weak steering currents. I contend that the ridge or heat dome has been pumped up by carbon pollution.
The last domino to fall might be political. Is the Trump administration and FEMA prepared for an epic natural disaster? You be the judge:
One more thing. In a warming world it stands to reason that hurricanes will ramp up faster, so systems don’t need as much real estate to go from a weak storm to a major hurricane approaching a coastline. Such has been the case with Harvey.
And now back to information about dangerous heat. Excessive heat watches have been posted for California, southern Nevada, Oregon, and portions of Arizona:
Here is what is expected in Oregon early next week:

I”ll be reporting on any record heat from the Southwest this weekend and beyond.
The Climate Guy
Thursday August 24th…
Dear diary. Just darn and my bad! I ended this blog too soon considering how hot it will be in the Southwest the next few days where I underestimated the strength of a developing heat dome. Going into September once monsoon moisture leaves the Southwest California can roast. A couple of days ago models started to forecast a rejuvenated Harvey. Now we may see the system getting up to category 3 strength or worse. Well, if Harvey can make a big comeback, so can the dreaded Heat Diary.☺
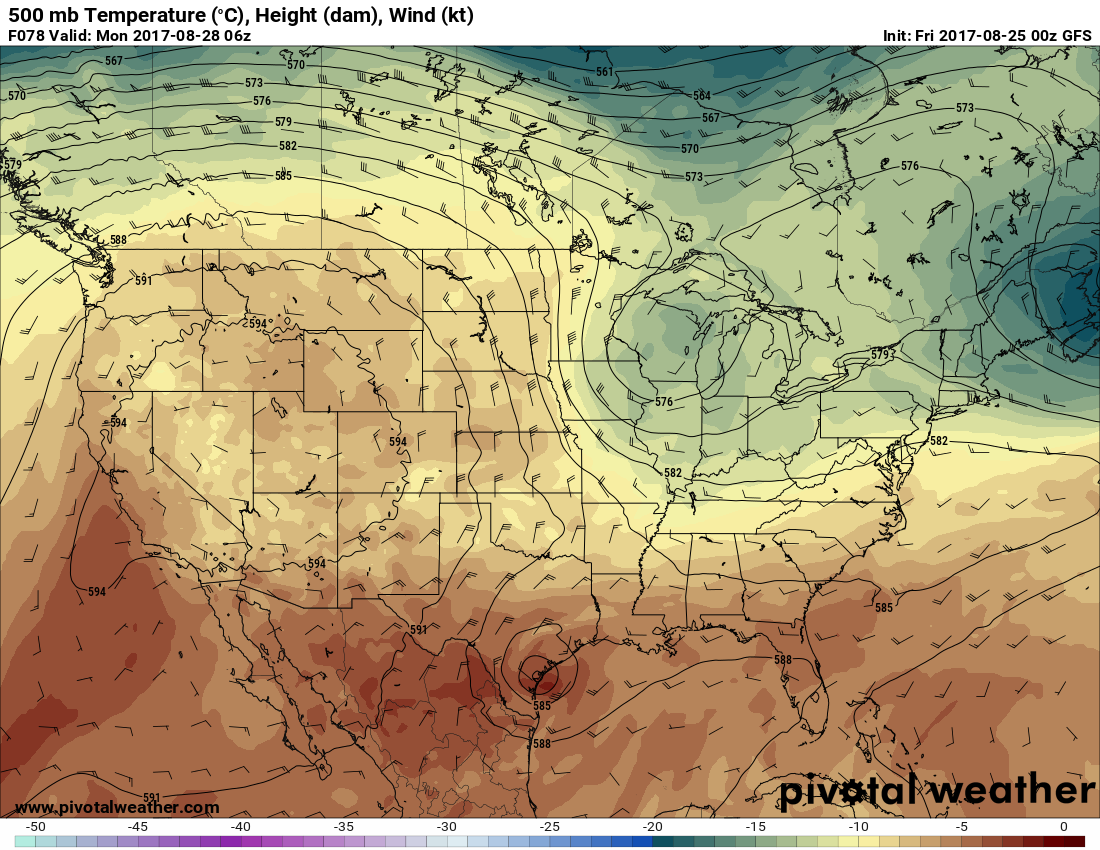
Here is the latest European model 500 Mb chart valid for Sunday:

Often west of a hurricane during the summer I’ve noticed that strong heat domes are present. That will certainly be the case with Harvey and a western ridge. What I’m most concerned with is any dangerous heat that will be developing in the Southern California/Los Angeles area.
The following are NWS graphics forecasting a coming heat event for early next week:

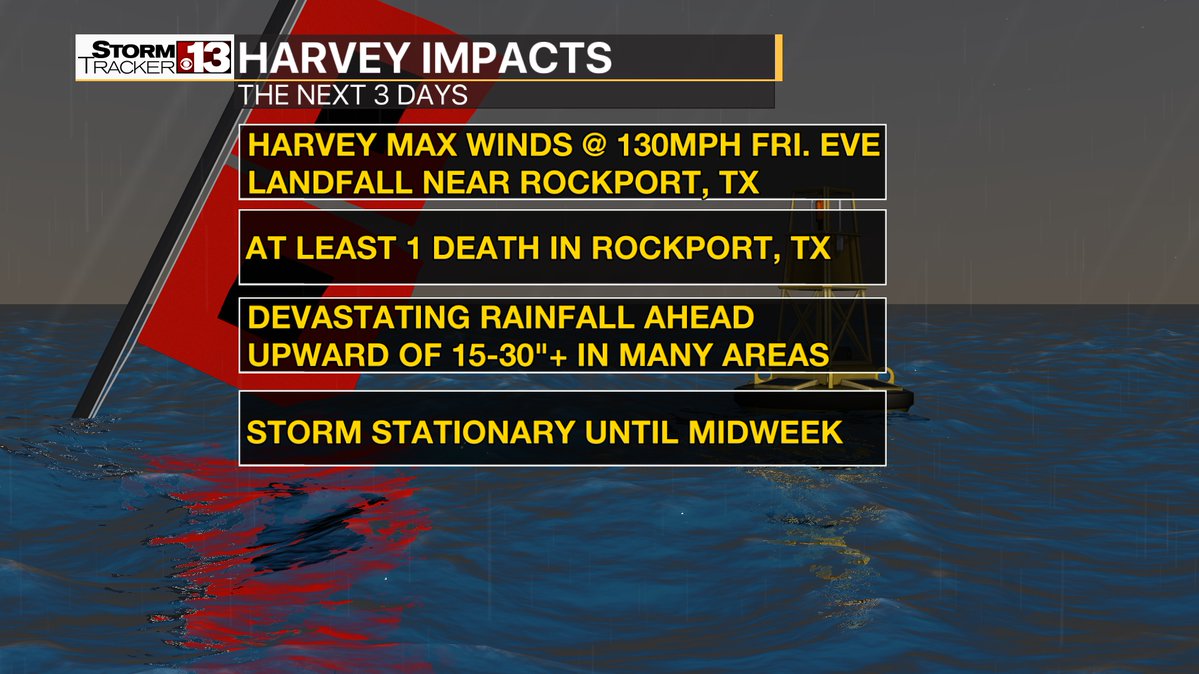
Since Harvey will be such a big deal, here is a good graphic on impacts across the western Gulf Coastal area:
Now back to what this blog is all about, dangerous heat. Here is what is expected in the Sacramento Valley this weekend:
While the old Climate Guy was away from this blog for one day the heat did play.☺ Here is an eye opening record that occurred Wednesday:

I’ll be adding more relevant information to this post going into this weekend.
To see all 2017 Heat Diary entries click:
https://guyonclimate.com/category/heatdiary2017/
The Climate Guy
It has been an awesome “Augtember” here, only hit 90F or higher 2 times this month so far and we may not hit it again before Sept. (St. Joe Missouri).