This week Bob Henson and I introduced the world to the concept of an index which has the potential to rank and statistically compare surface temperature records.
For a detailed explanation see:
So for this post let’s do some calculations using the ETI for some very recently set records. These come from March 21st, 2017 and are listed here: https://www.ncdc.noaa.gov/cdo-web/datatools/records
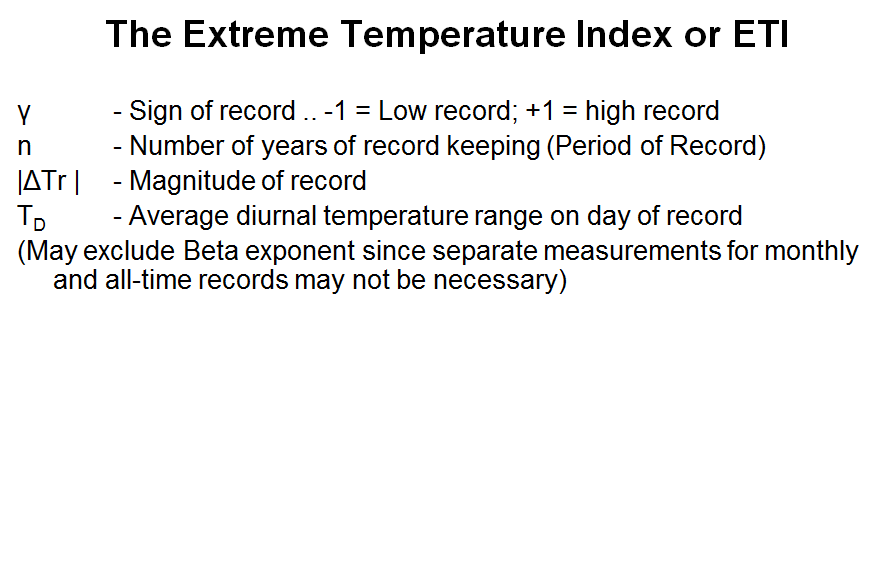
First, the current algorithm and formula for the Extreme Temperature Index are presented here:
![]()
 Let’s start with one of the hotter records that was set that day: Big Spring, TX, which got up to 94 F and broke their record by 2F (I took the averages or norms for the min and max from Midland, TX, which is close to Big Spring):
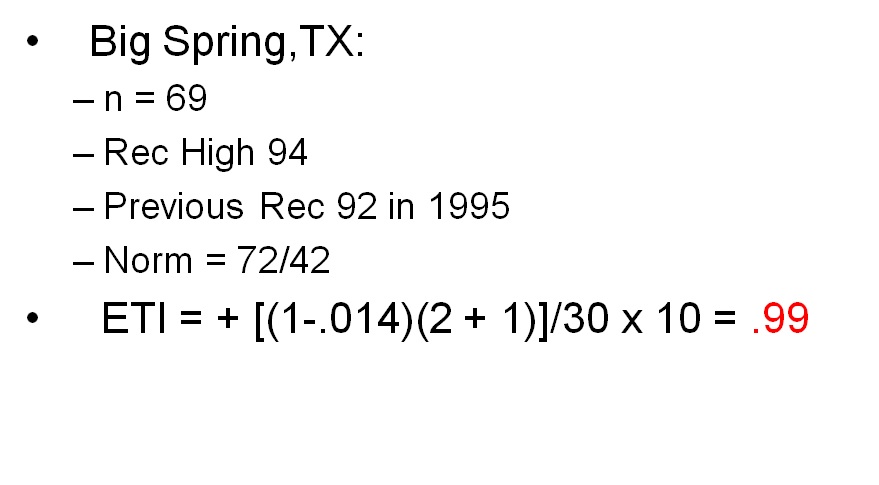
Now let’s take another site which also broke its record by 2 degrees on the same day, Marshfield, MO, which is near Springfield (from where I took the average max/min):
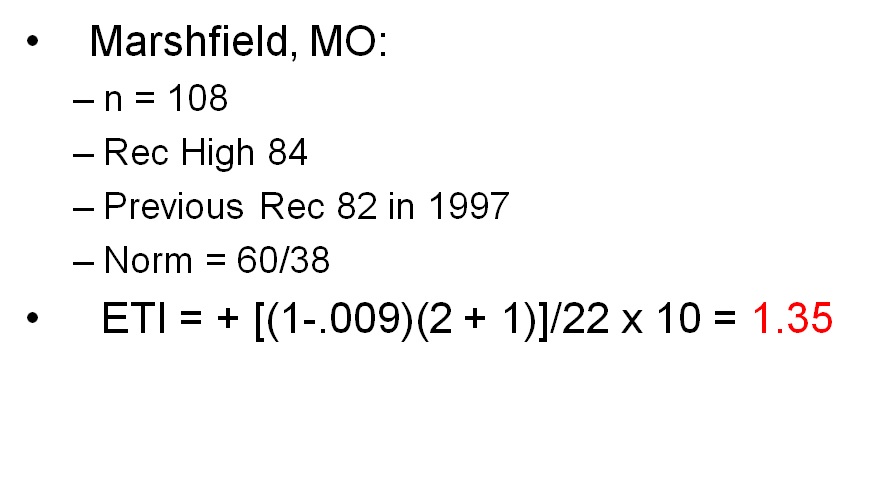
Despite the fact that Big Spring had the hotter record, using the ETI method, Marshfield set a statistically more significant one due to the fact that its period of record, or n, was longer and the difference between the average max and min was less.
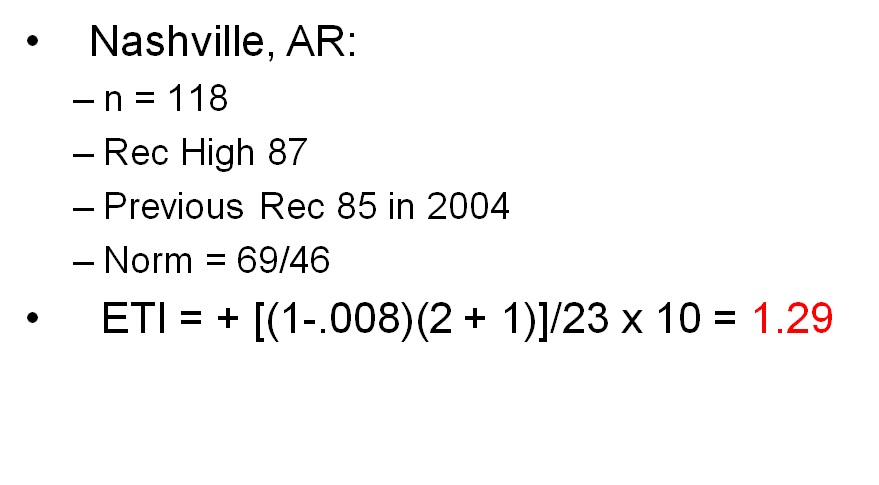
Let’s take a look at a couple more. Nashville, AR established a new record of 87 also in 3/21/17. Since this station is near Texarkana, AR I am taking the average max/mins from that station:
The next is from Sheridan, AR, which also set a new record of 87 but is a relatively new station. Sheridan is near Little Rock, so I plugged in LIT’s average max/mins:
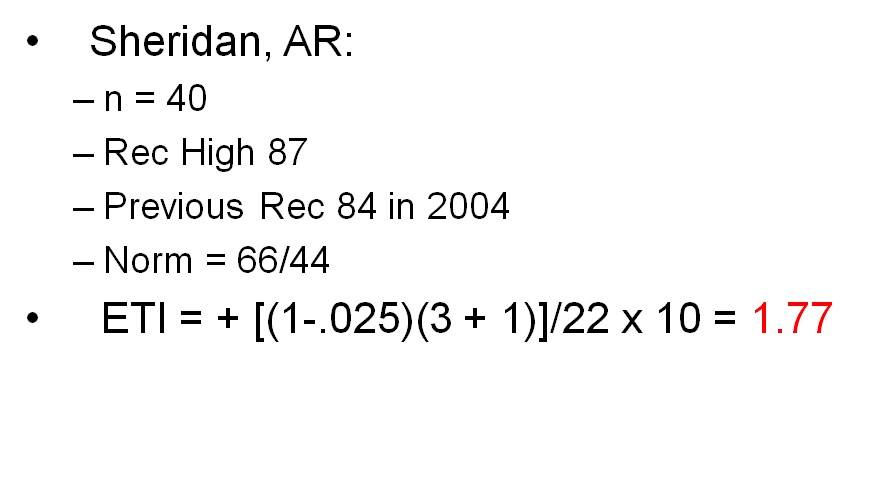 The ETI for Sheridan is higher since the difference between the old record and new is weighted higher in the algorithm than other factors such as period of record.
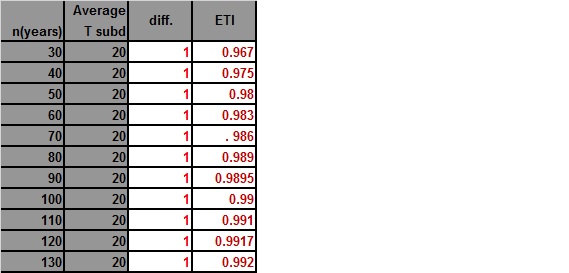
Another method for looking at the viability of an algorithm is to hold all the variables constant while changing one. The ETI has three variables. Using some simple math I have made three tables that show the ETI number changing while one variable increases.
The first shows n, or the period of record, increasing. I choose 30 years as a starting point since that figure is the bare minimum period of record keeping for a station to be eligible in the NCEI database.
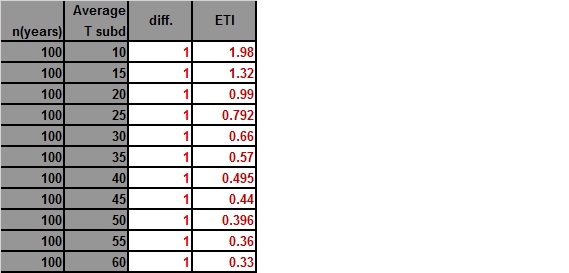
The second shows the difference between the average maximum and minimum changing. Why is this important? Again, T sub d is a reflection of how “continental” or how far inland a station is, and is taken into account in the ETI.
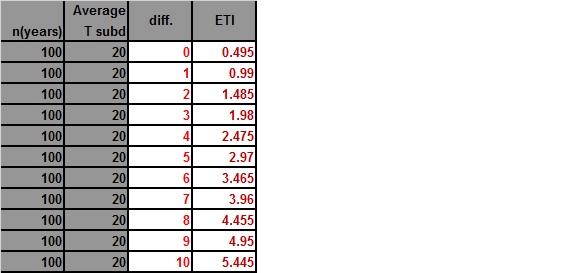
The third, and as you can see most weighted variable looking at how much the ETI number changes, is the difference between the old and new record.
With time, I will be adding more ETI calculations to this post. Drop me a note if you want me to calculate a specific ETI for a set record…. maybe one near you.😊
The Climate Guy
Great write up. Thanks for your hard work.
Is it possible for you to post a tweet when you do a new article?
I tend to see it sooner via Twitter, than anywhere else.
Thanks
Rick Highsmith