Using National Center for Environmental Information data, the last two years (from DEC 2014 through NOV 2016) have been the hottest in the lower 48 states since 1895:
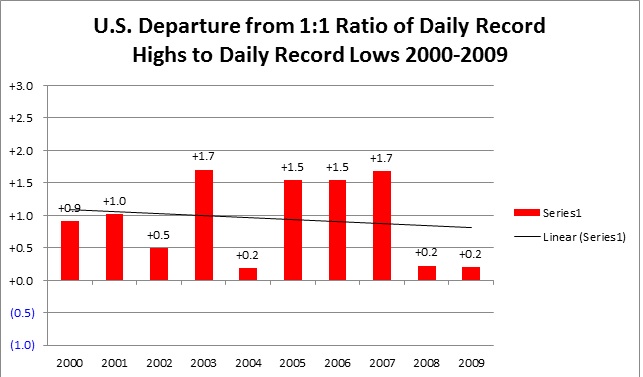
It is no wonder that we observed 24 months in a row of more daily record highs than lows as shown in our last post over the same period from DEC 2014 through NOV 2016. So what, besides carbon pollution, was the main culprit ramping up the heat in the U.S.? The very short answer is a “strong” El Nino. The last two strong El Nino’s were of record proportion and occurred from 1997-1998 and from 2015-2016. After the 1997-1998 El Nino there were many more record highs than lows in 1998 and 1999 than for the rest of the decade of the 1990’s as shown here:

JAN 1998 through DEC1999 turned out to be the second warmest two year period on record in the NCEI data base.
During the 2000’s there was not a near record strong El Nino, but every year of that decade saw more daily record highs than lows due to carbon pollution. There was not, however, a year that had as high of a ratio of daily record highs to lows as had occurred in 1998. Also, there was a slight cooling trend, however, during the decade fueling denialist claims that anthropogenic global warming was not occurring.
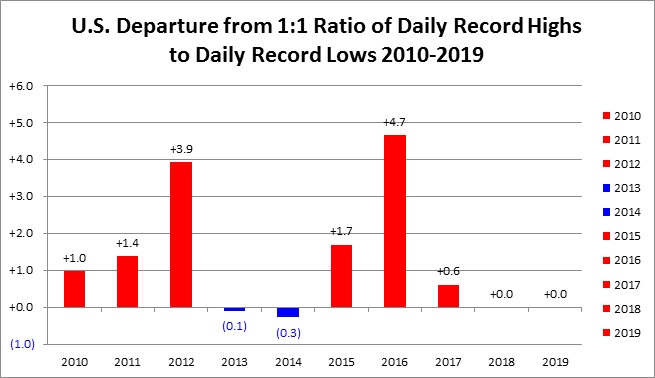
This decade there was a sharp spike in the ratio of daily record highs just last year. In fact the ratio of 5.7 to 1 in 2016 was the highest I have recorded since 1920.
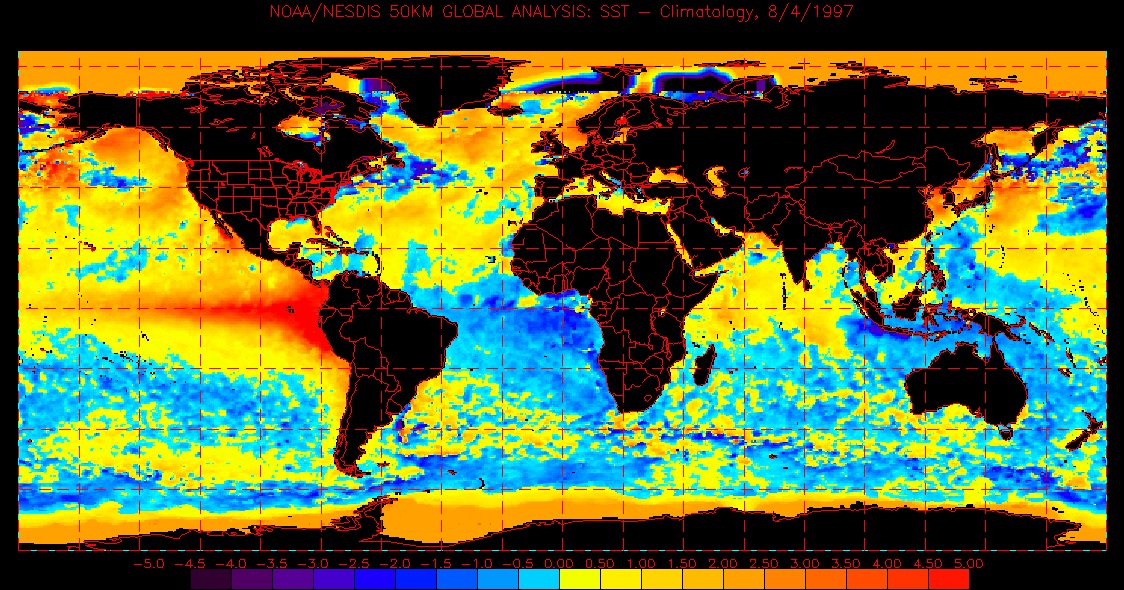
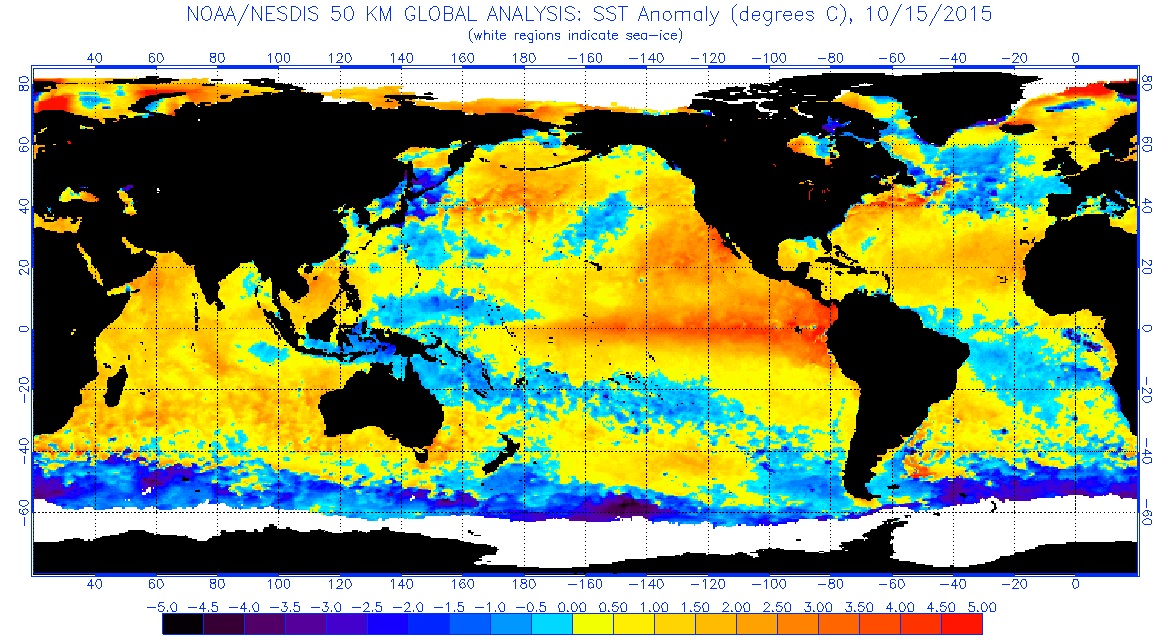
So, we have two 2 year periods in the United States which ranked number 1 and 2 coinciding with the two strongest El Nino’s in recorded history….coincidence? I think not. There was a lag of a few months between the peak of the El Nino event in 1997 and high heat in the U.S. in 1998, though. For comparison’s sake, here are two sea surface charts depicting when these last two strong El Nino episodes were near their peak:
Think of a strong El Nino as opening a pressure valve in the Pacific releasing excess latent heat pent up in an enormous balloon… The Earth’s oceans. Due to carbon pollution, El Nino should become more frequent, so say many experts. Some forecasters are predicting that at least a weak El Nino will develop again by mid-2017. The jury is still out on global warming increasing El Nino’s, particularly those categorized as “strong”, but if they become more frequent the warming trend across this planet will increase, alarmingly so, more than what is occurring already. Underwater currents feed into the Nino region so that excess heat can be more quickly released from the ocean than otherwise…. Mother Nature’s way of trying to thermally balance the seas. When a strong El Nino occurs, planetary averages spike and likewise for the United States. The year 2016 will go down as a “spike” on graphs with 2017 likely to be at least slightly cooler. I am particularly interested in year to year spikes and nadirs on graphs and charts because they can tell us something.
Why is this important? If a better correlation between moderate to strong El Nino’s and planetary heat gets established, then people in agriculture, forestry, and those trying to make seasonal forecasts will be able to make better educated guesses about how much environmental stress will occur from year to year. Forecasts for ENSO events are getting better, but aren’t that great yet. The 2015 event was supposed to have occurred in 2014 but, for some unknown reason was delayed for about a year. When the next strong El Nino occurs, experts can make better heat forecasts for the U.S., possibly preventing deaths.
We will look at some spikes and nadirs on some other charts next.
The Climate Guy
You are awesome